Every screenshot below is from the live AuditDSS platform. This is what you get when you upload your compliance document — obligation-level gap analysis with 4-axis risk scoring, enforcement data, and remediation guidance.
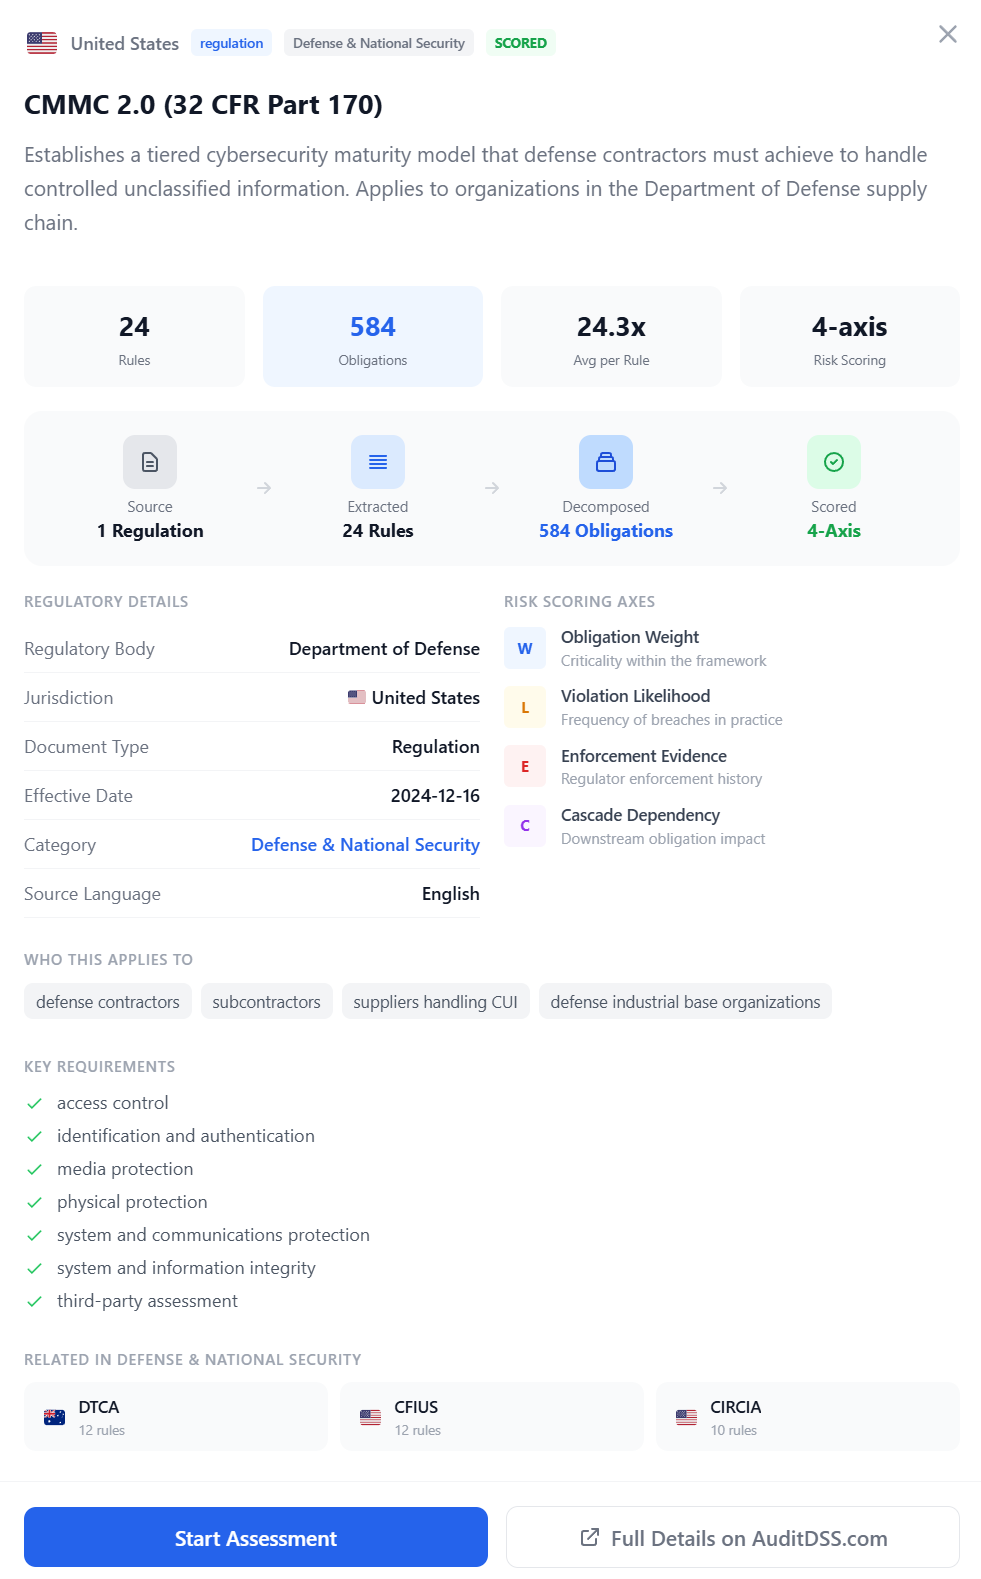
Compliance Assessment
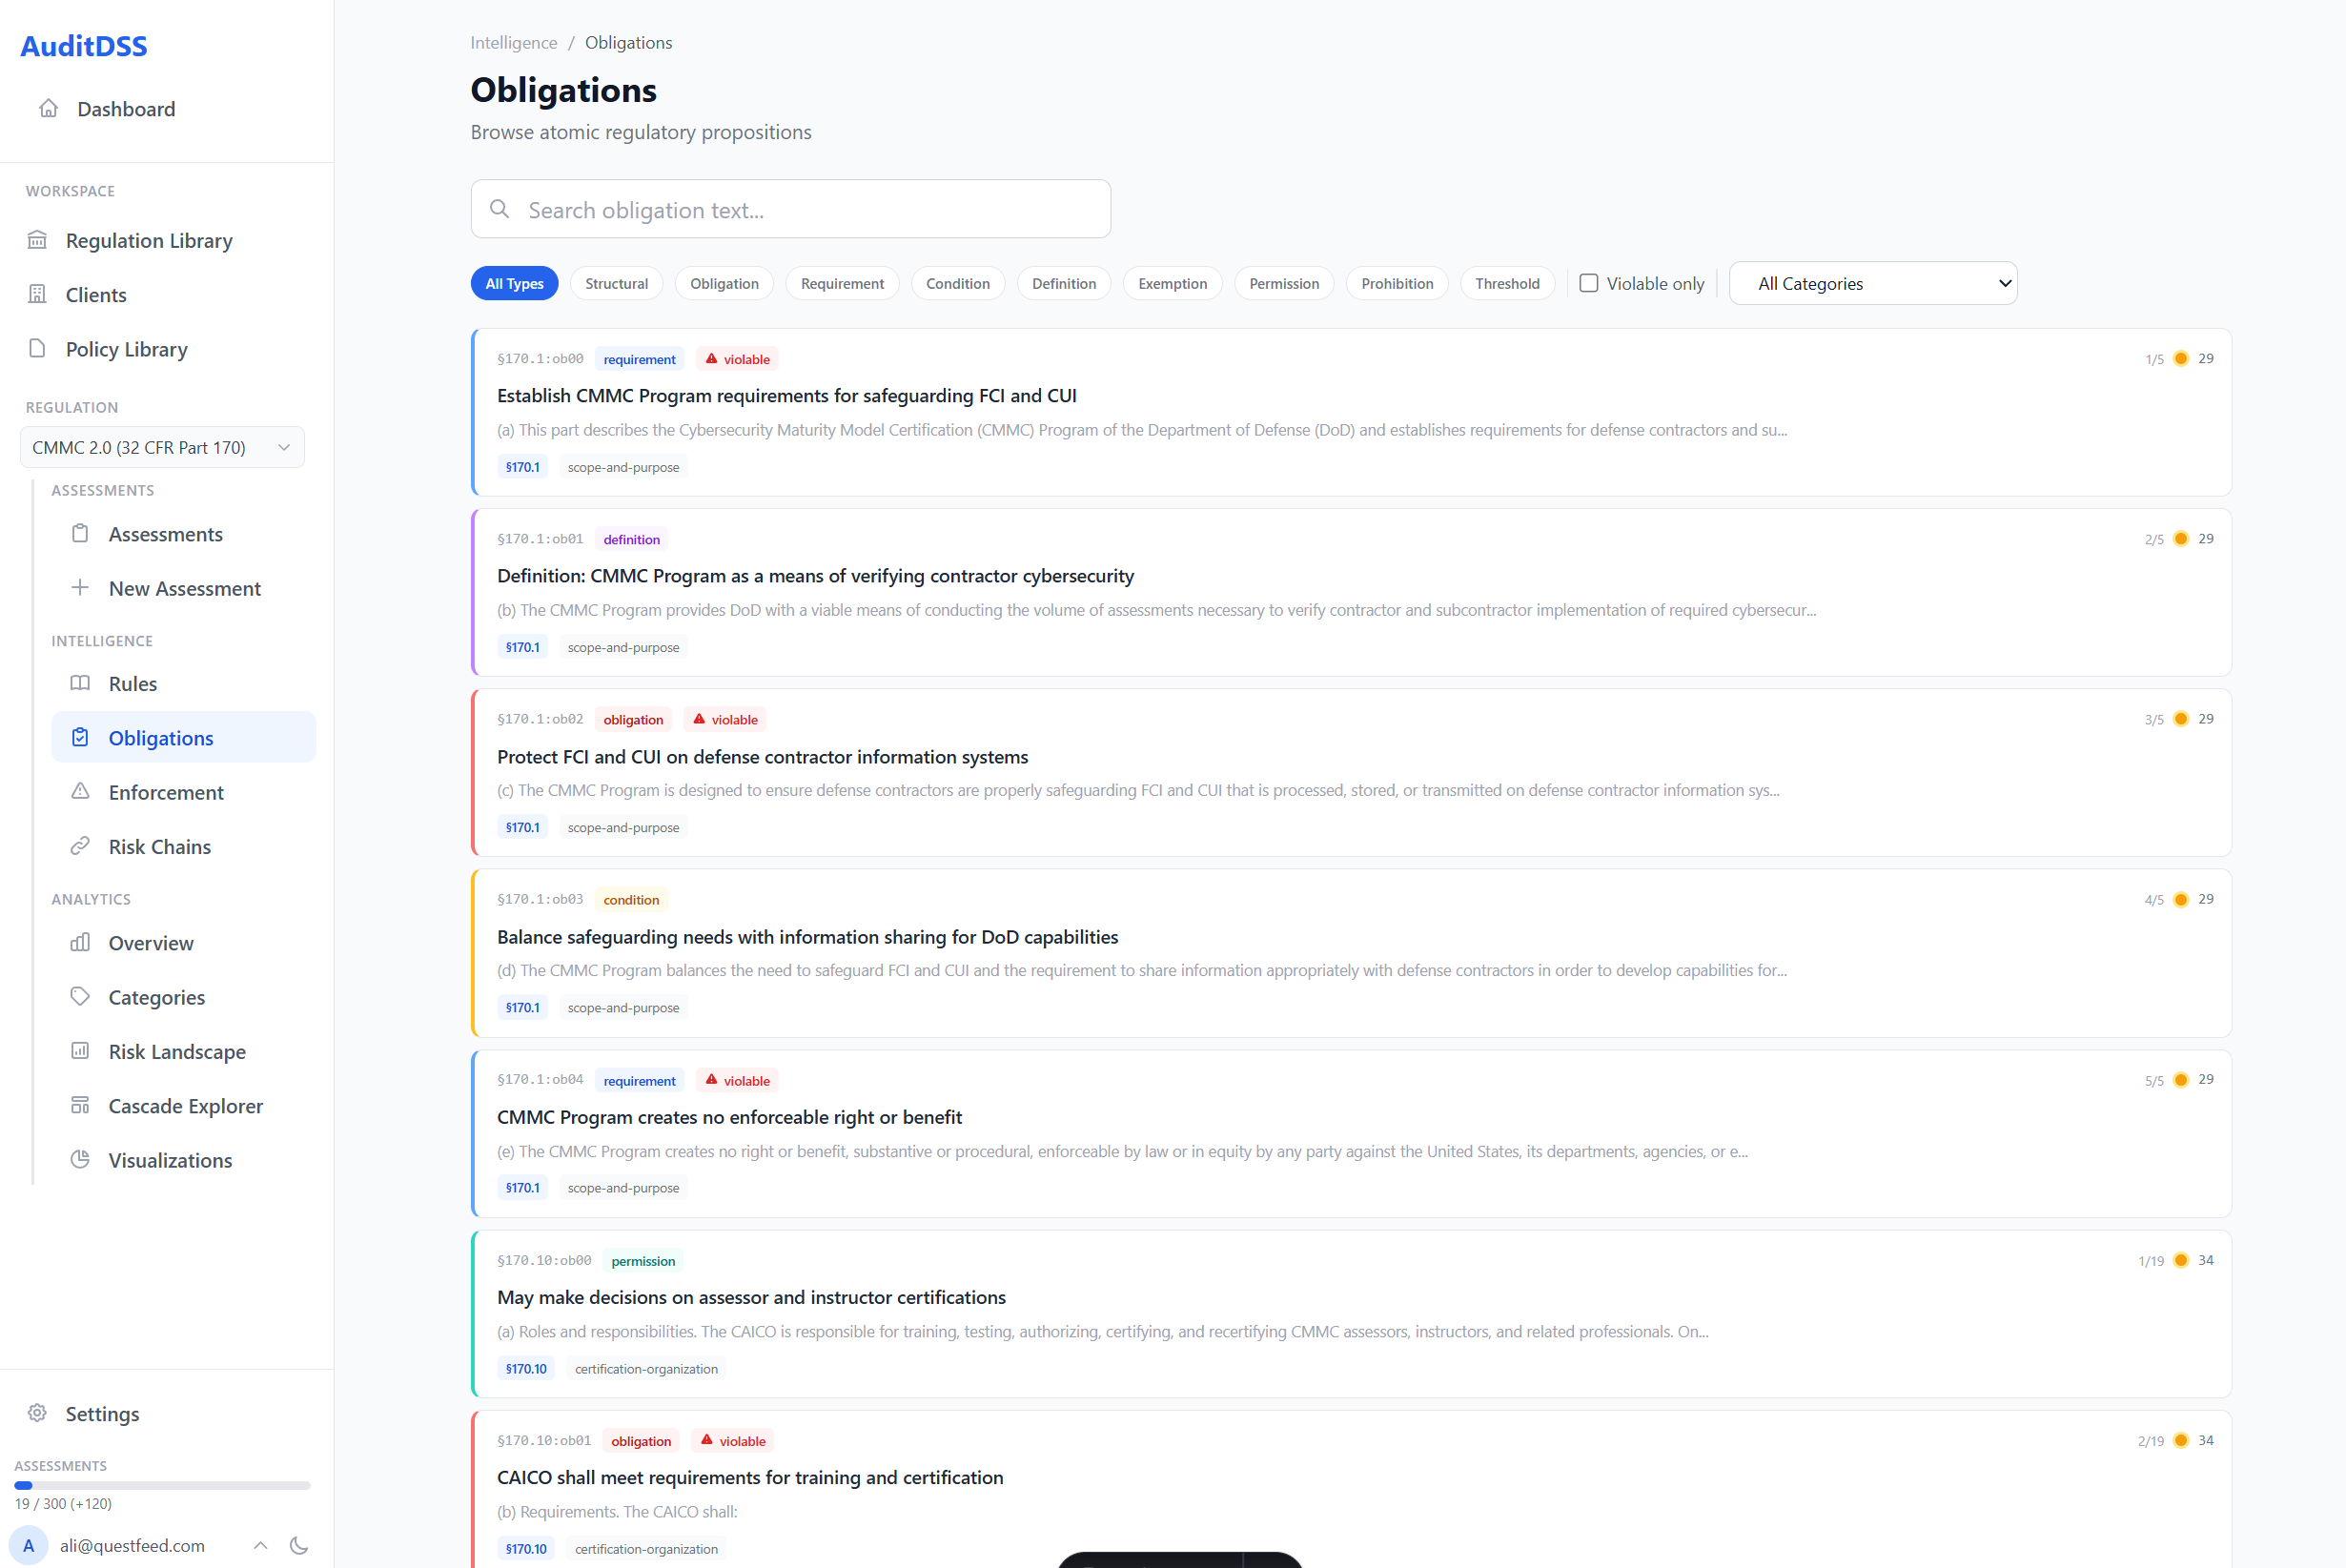
Upload your compliance document and get an executive summary, coverage breakdown, risk-scored gaps, and remediation guidance. Every obligation is individually assessed.
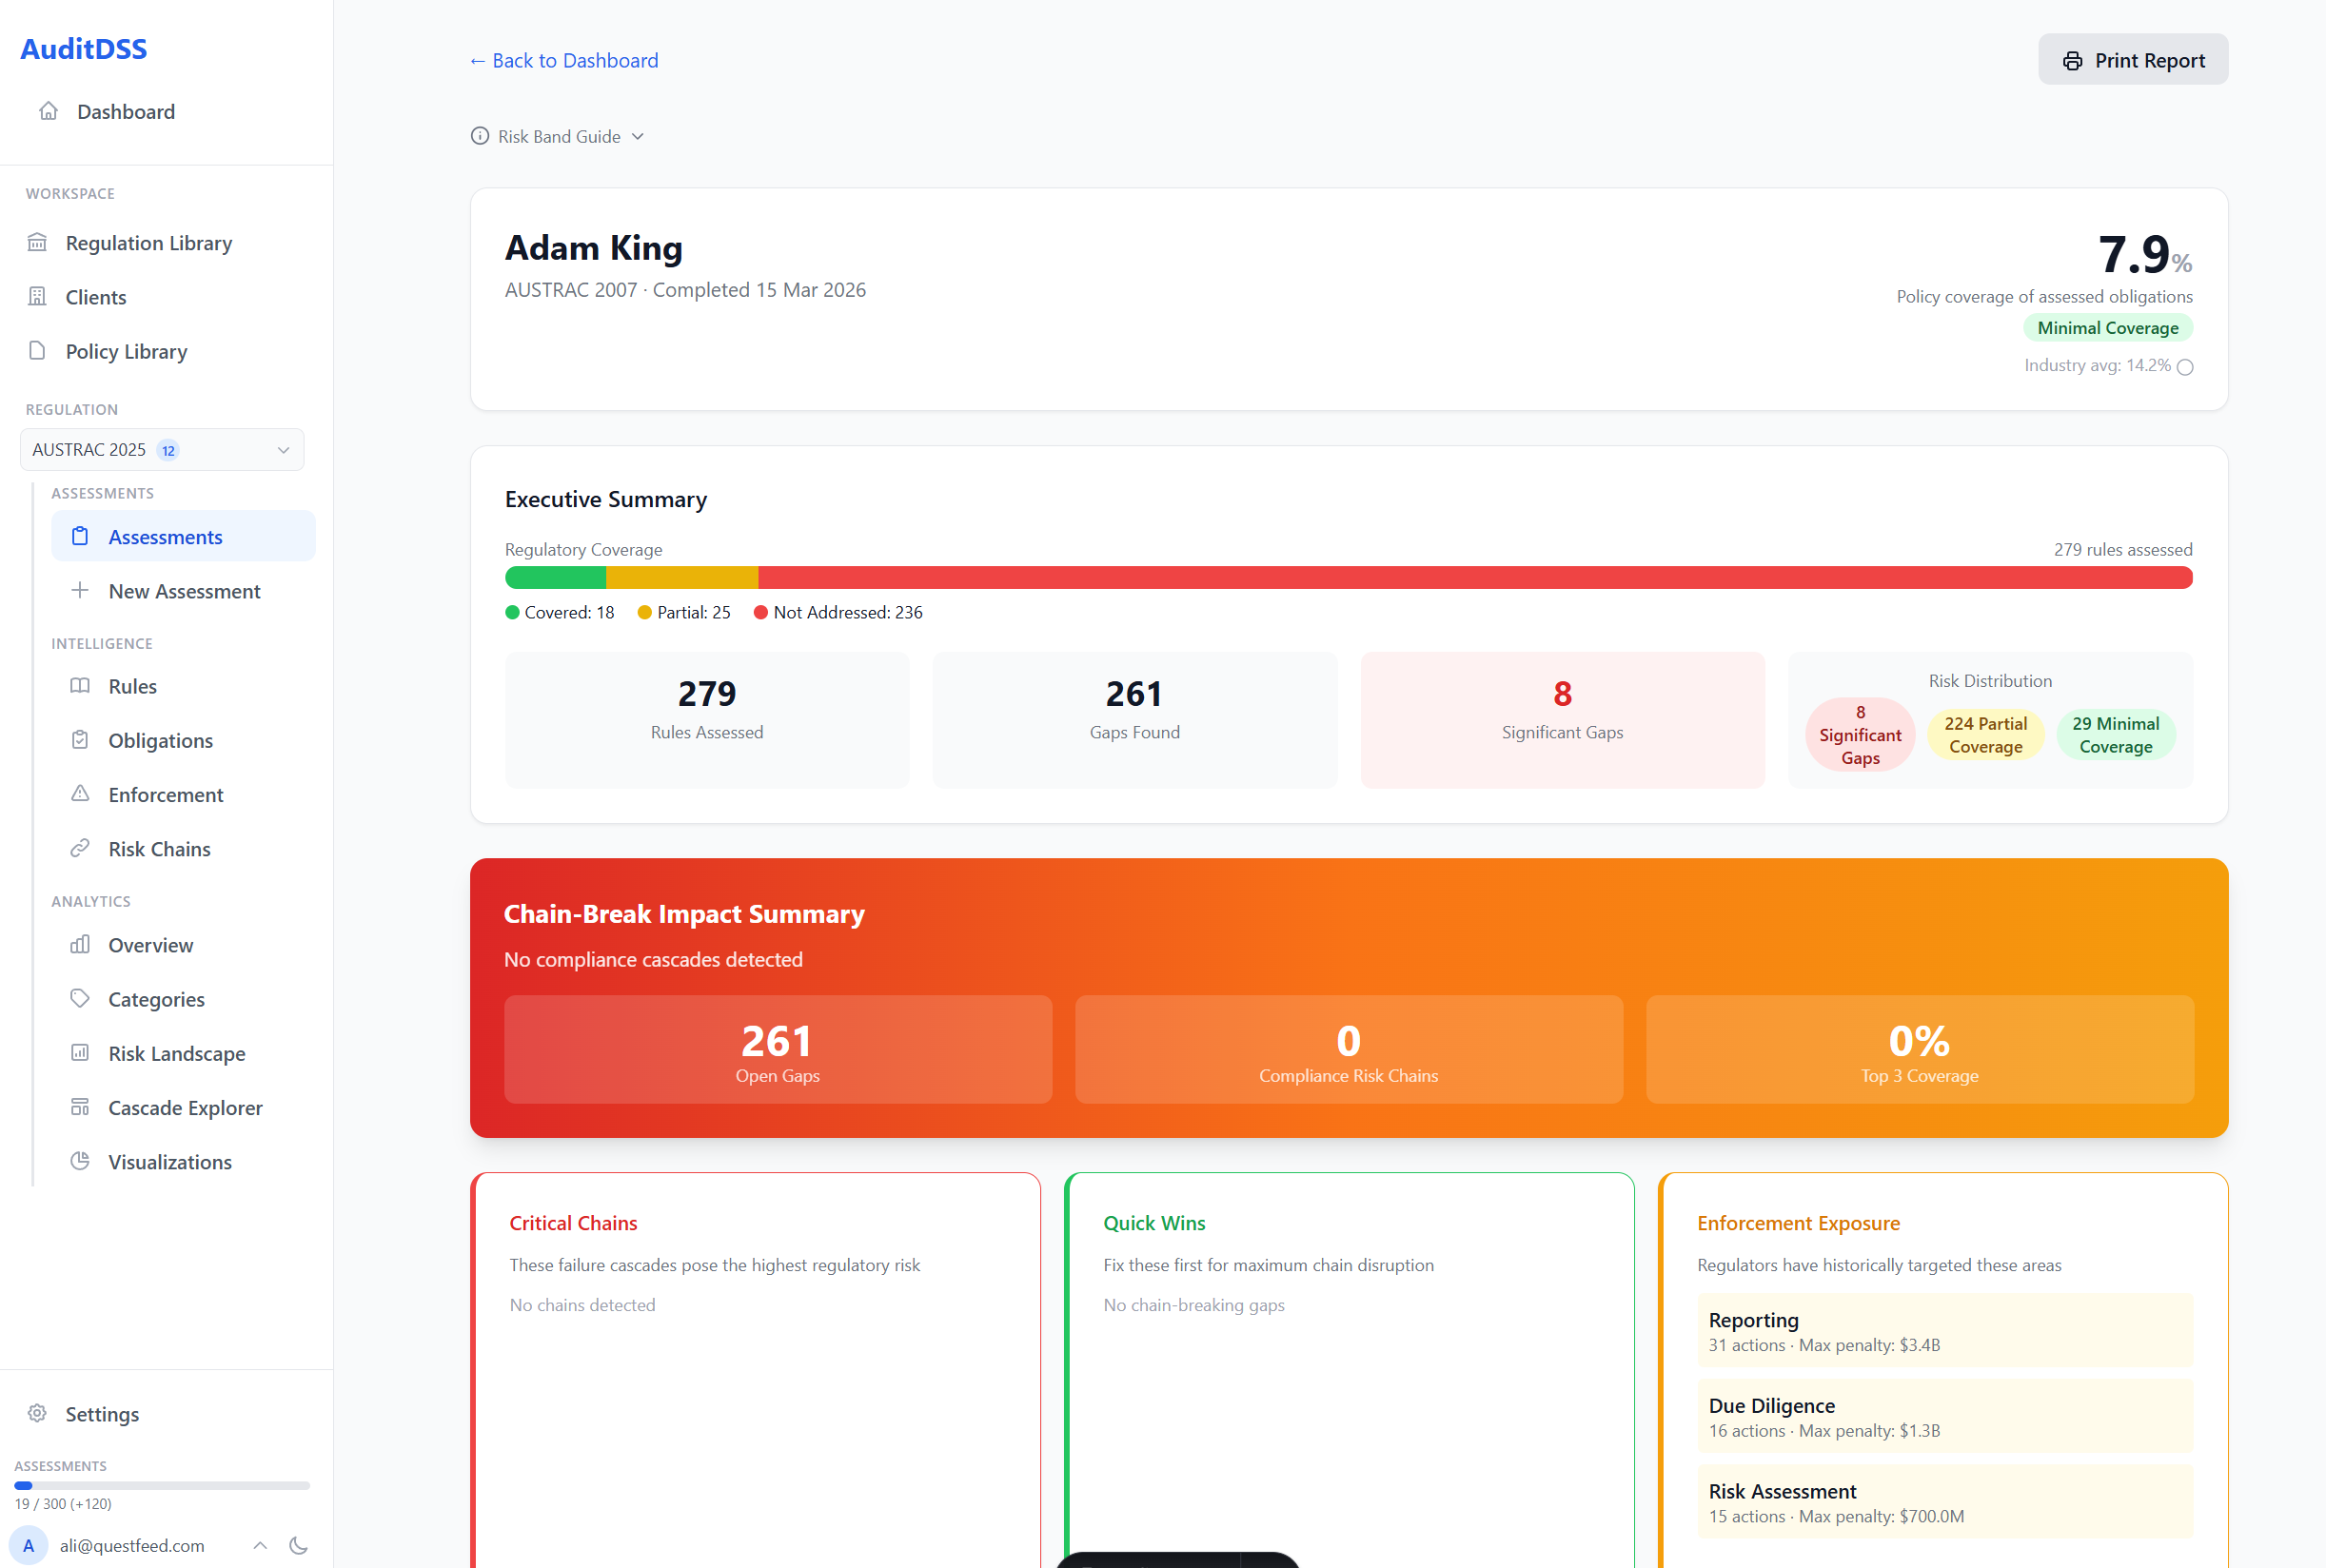
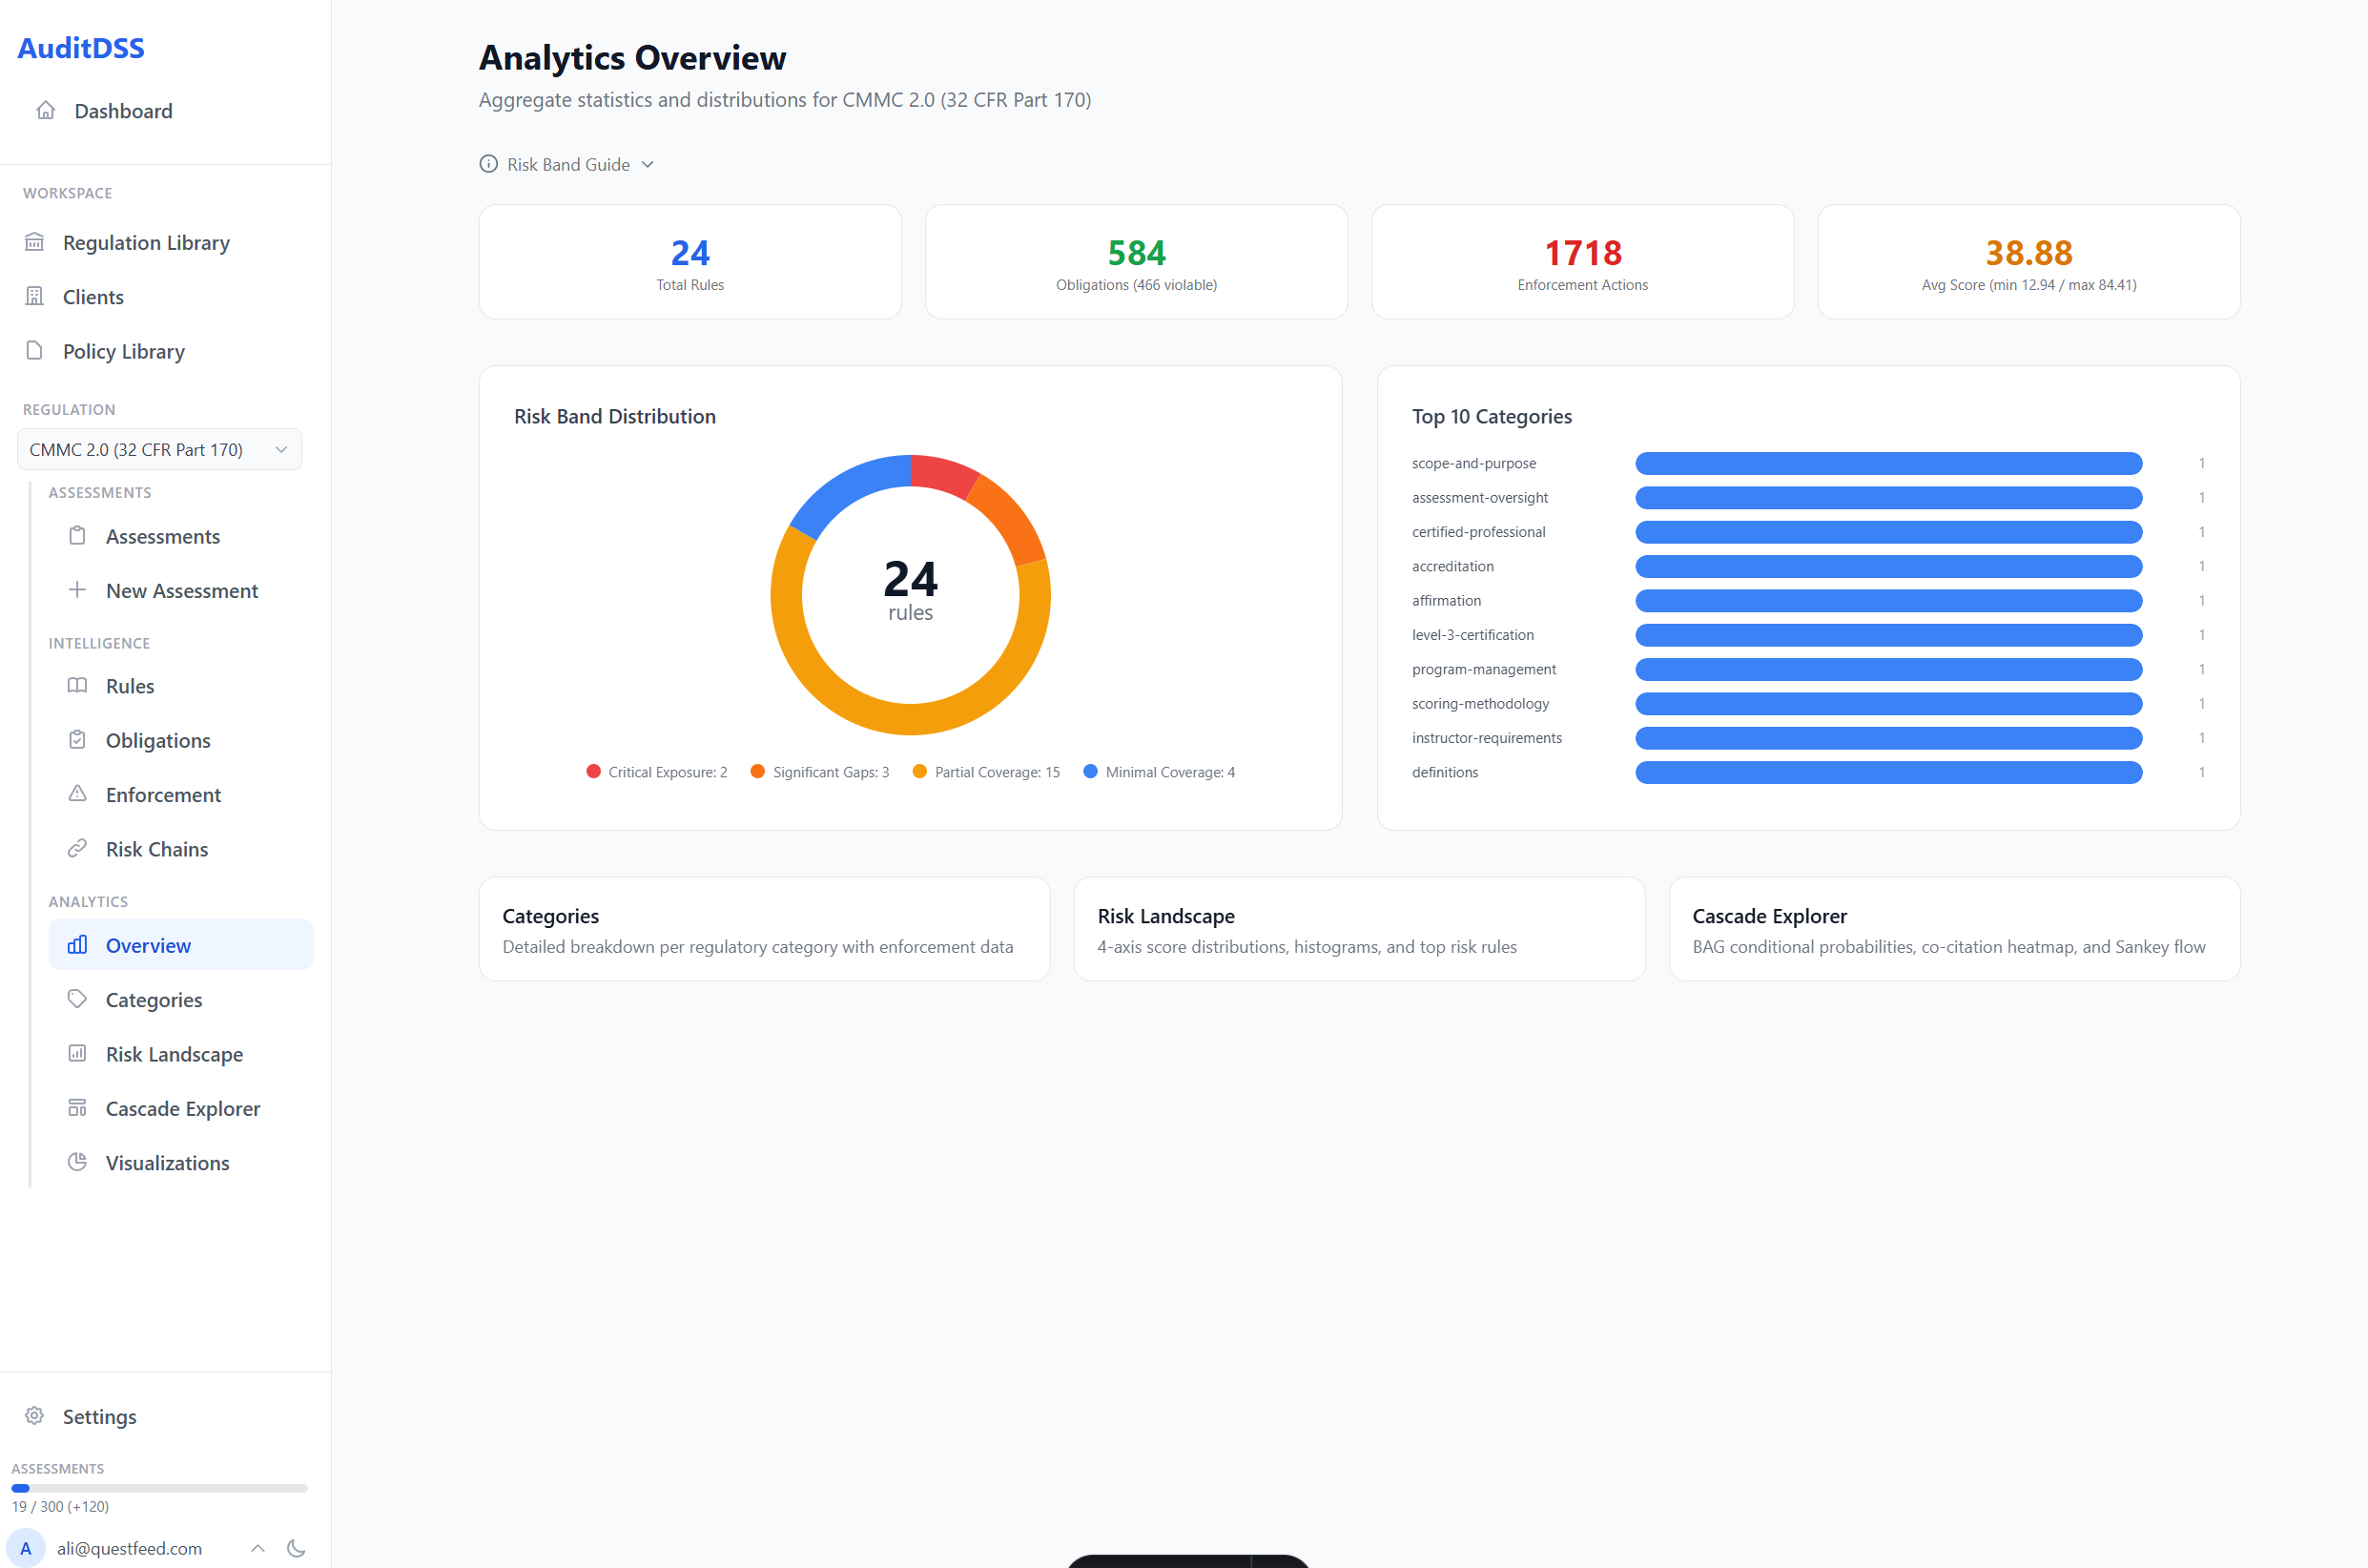
Executive Summary
Overall compliance score, gap distribution, chain-break impact analysis, and enforcement exposure breakdown.
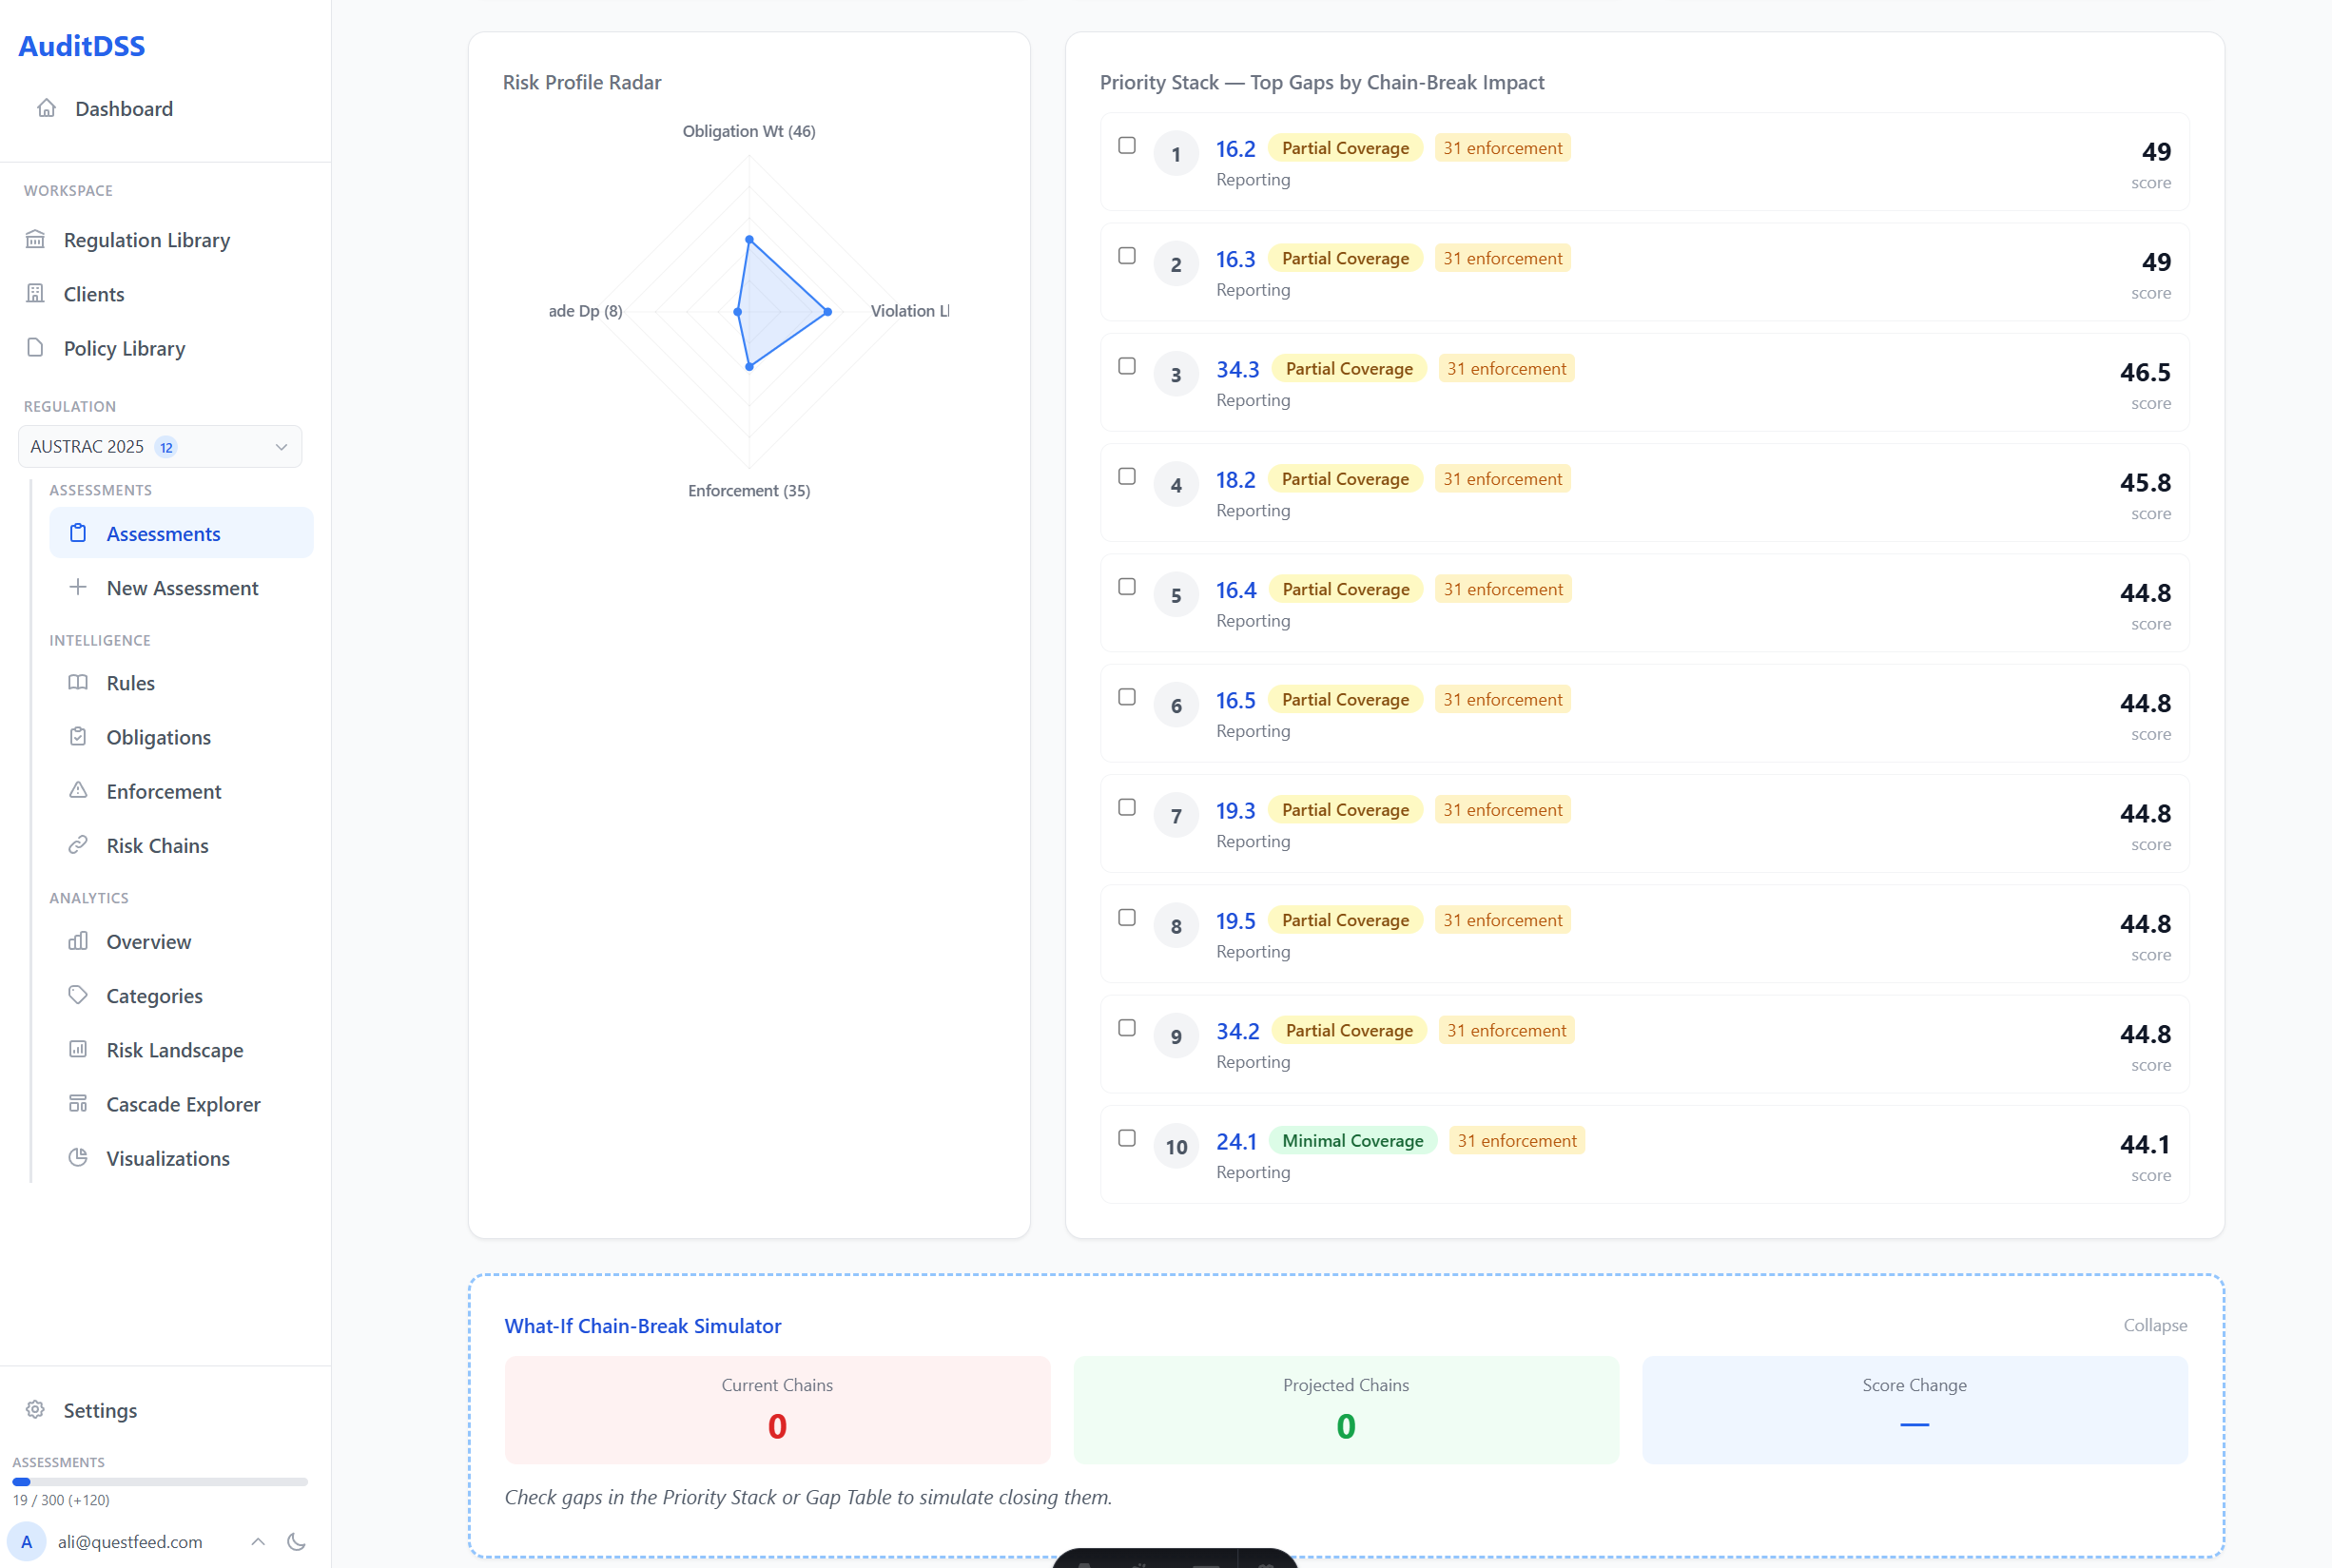
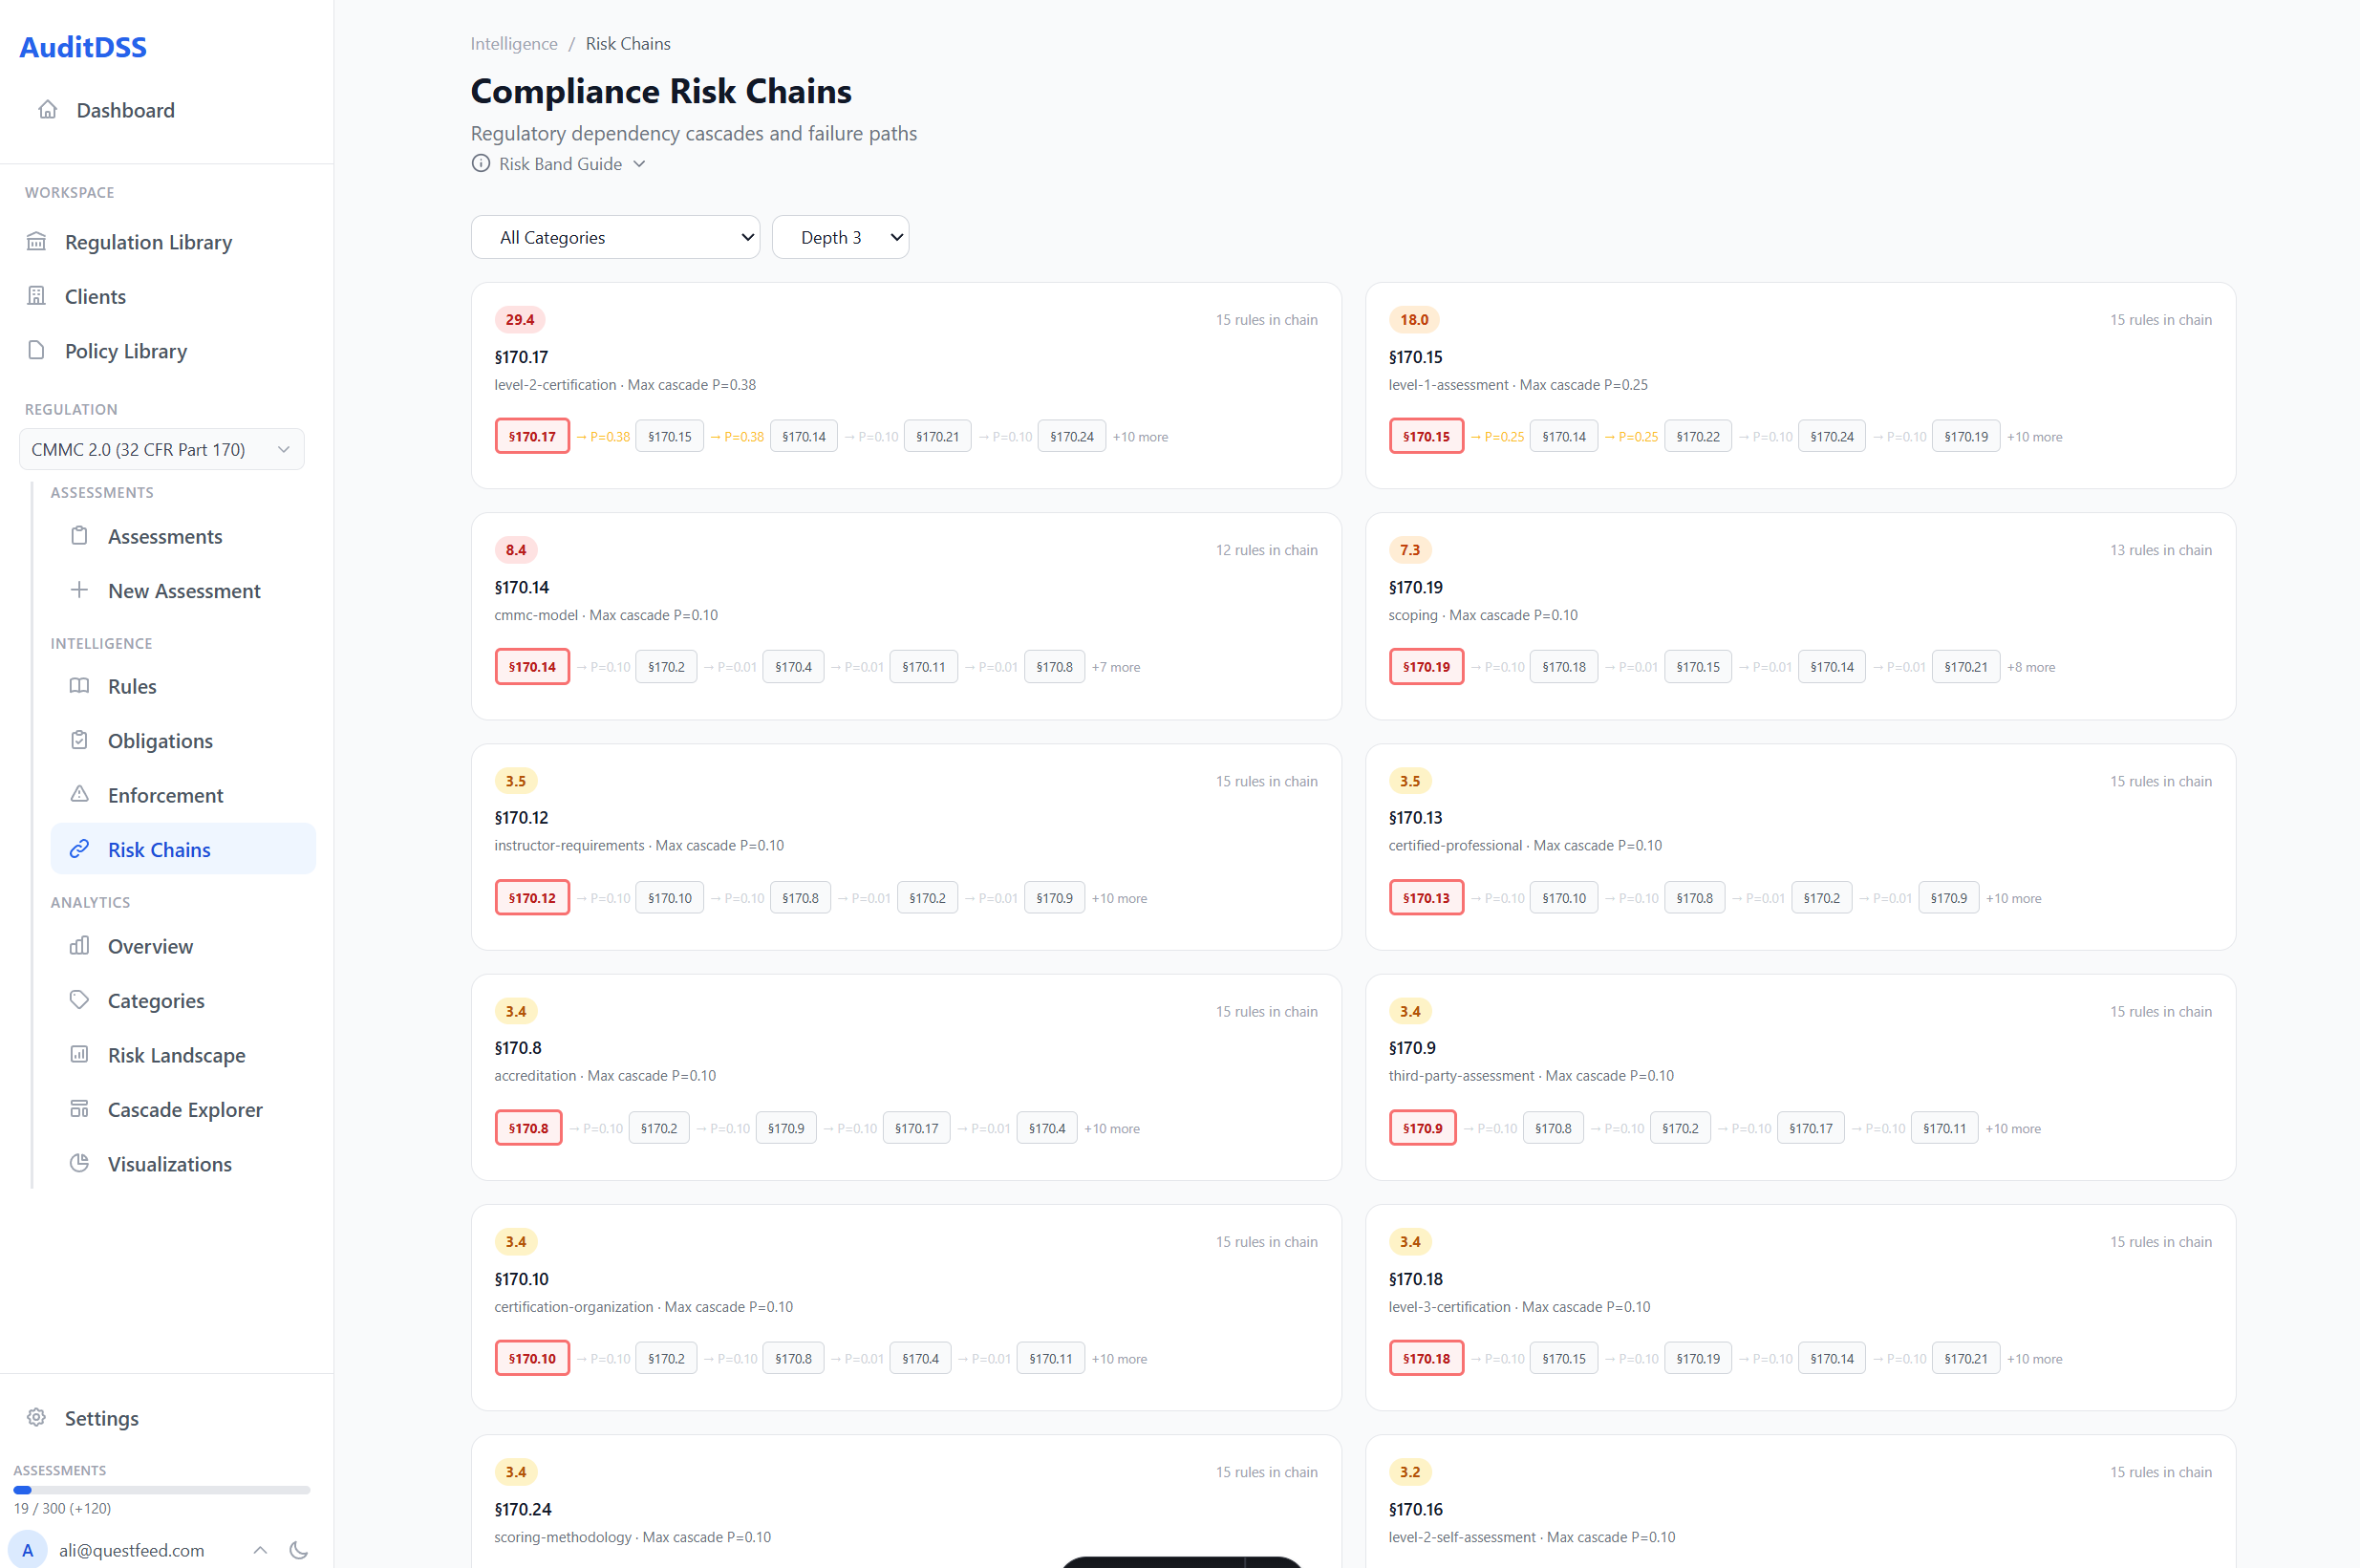
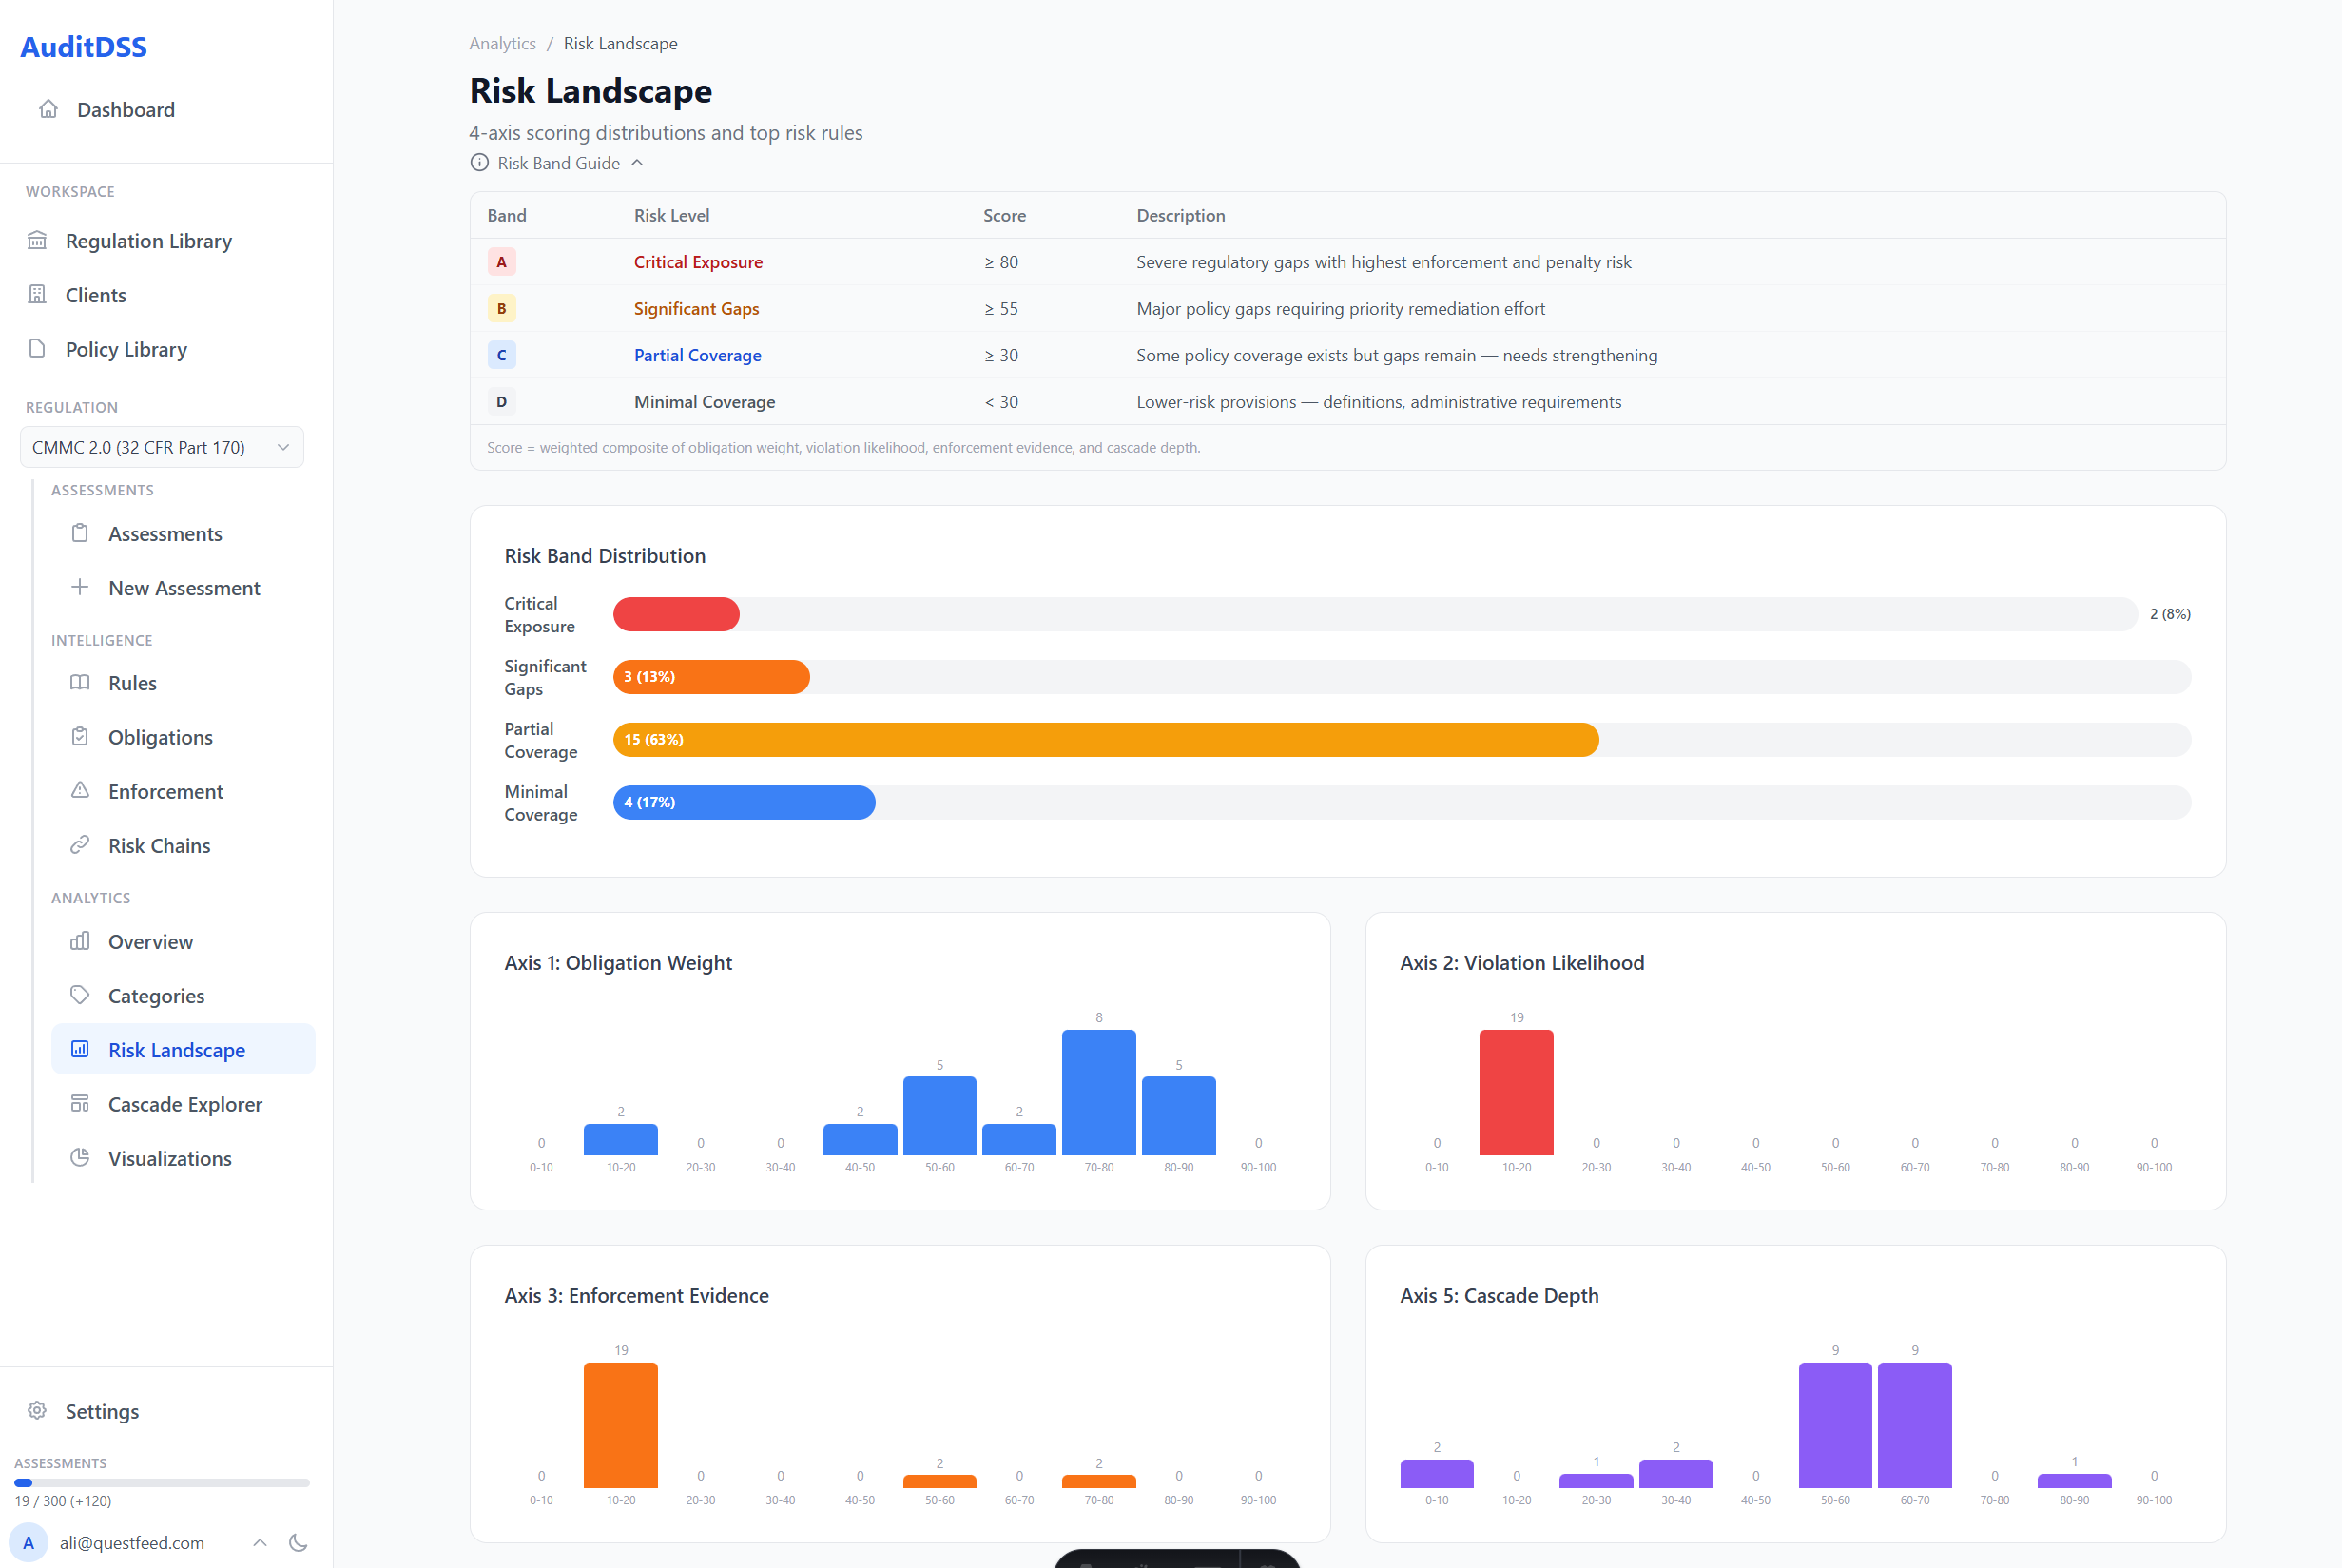
Risk Radar & Priority Stack
4-axis risk profile radar and gaps ranked by chain-break impact .
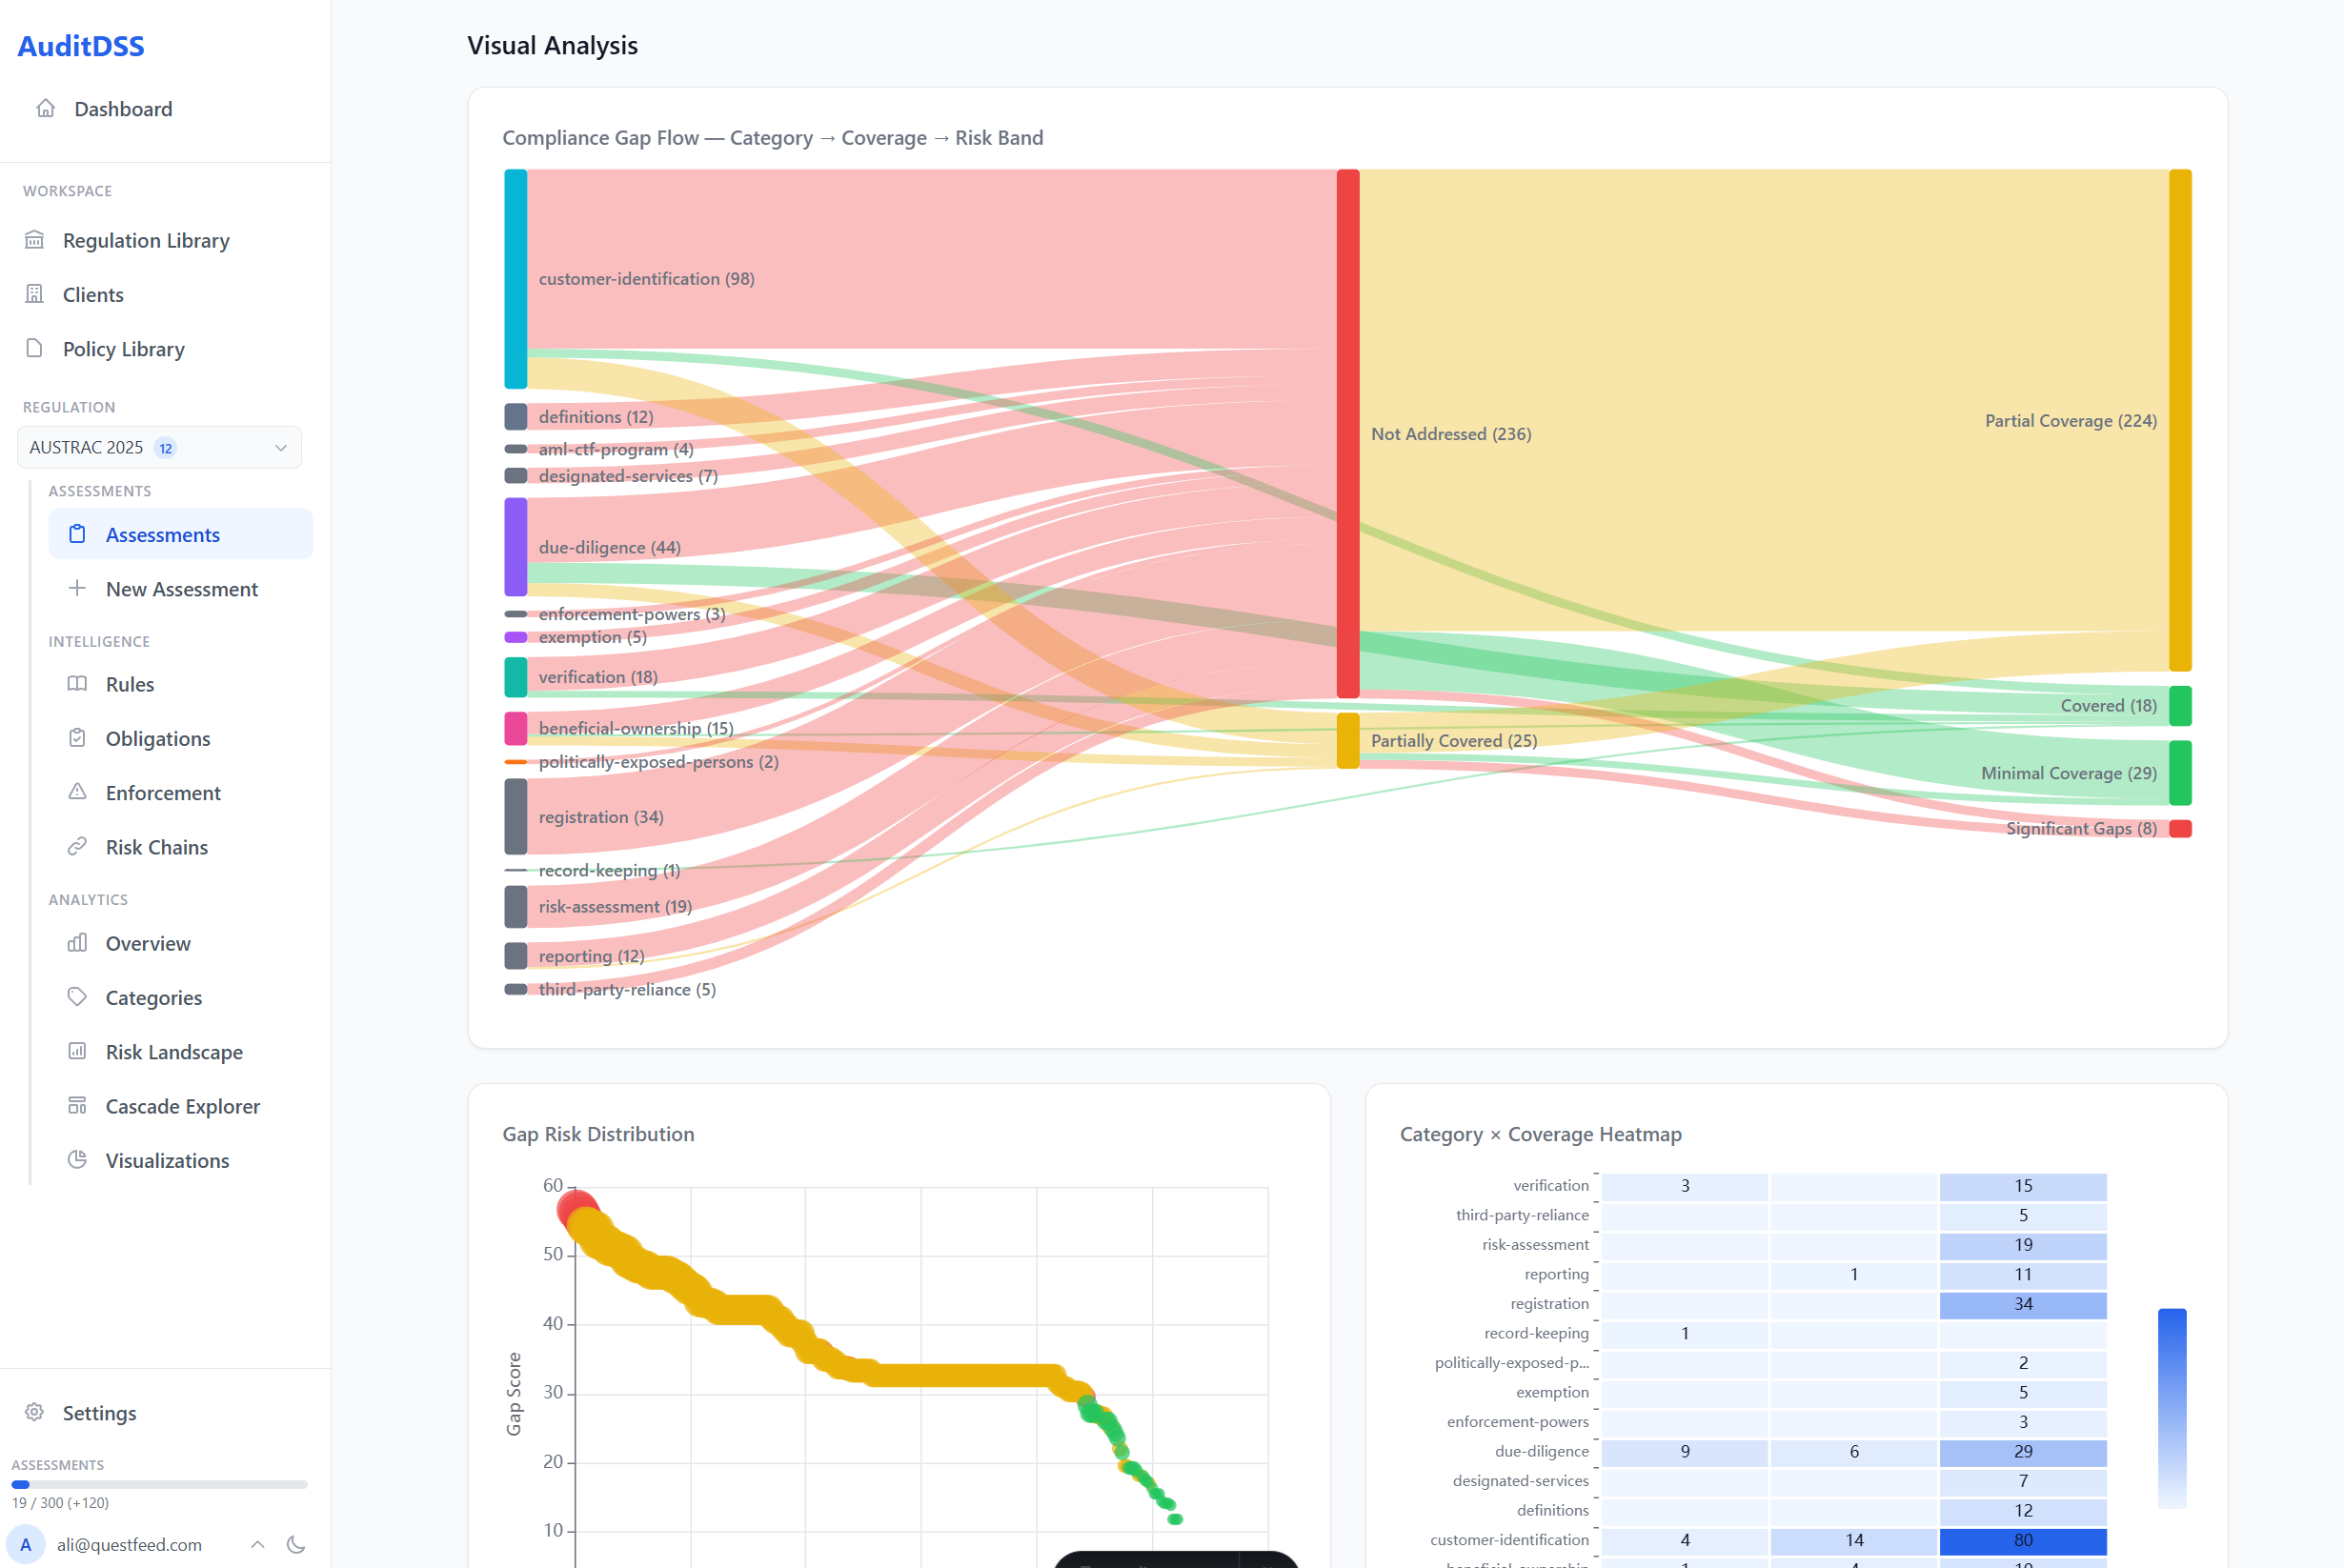
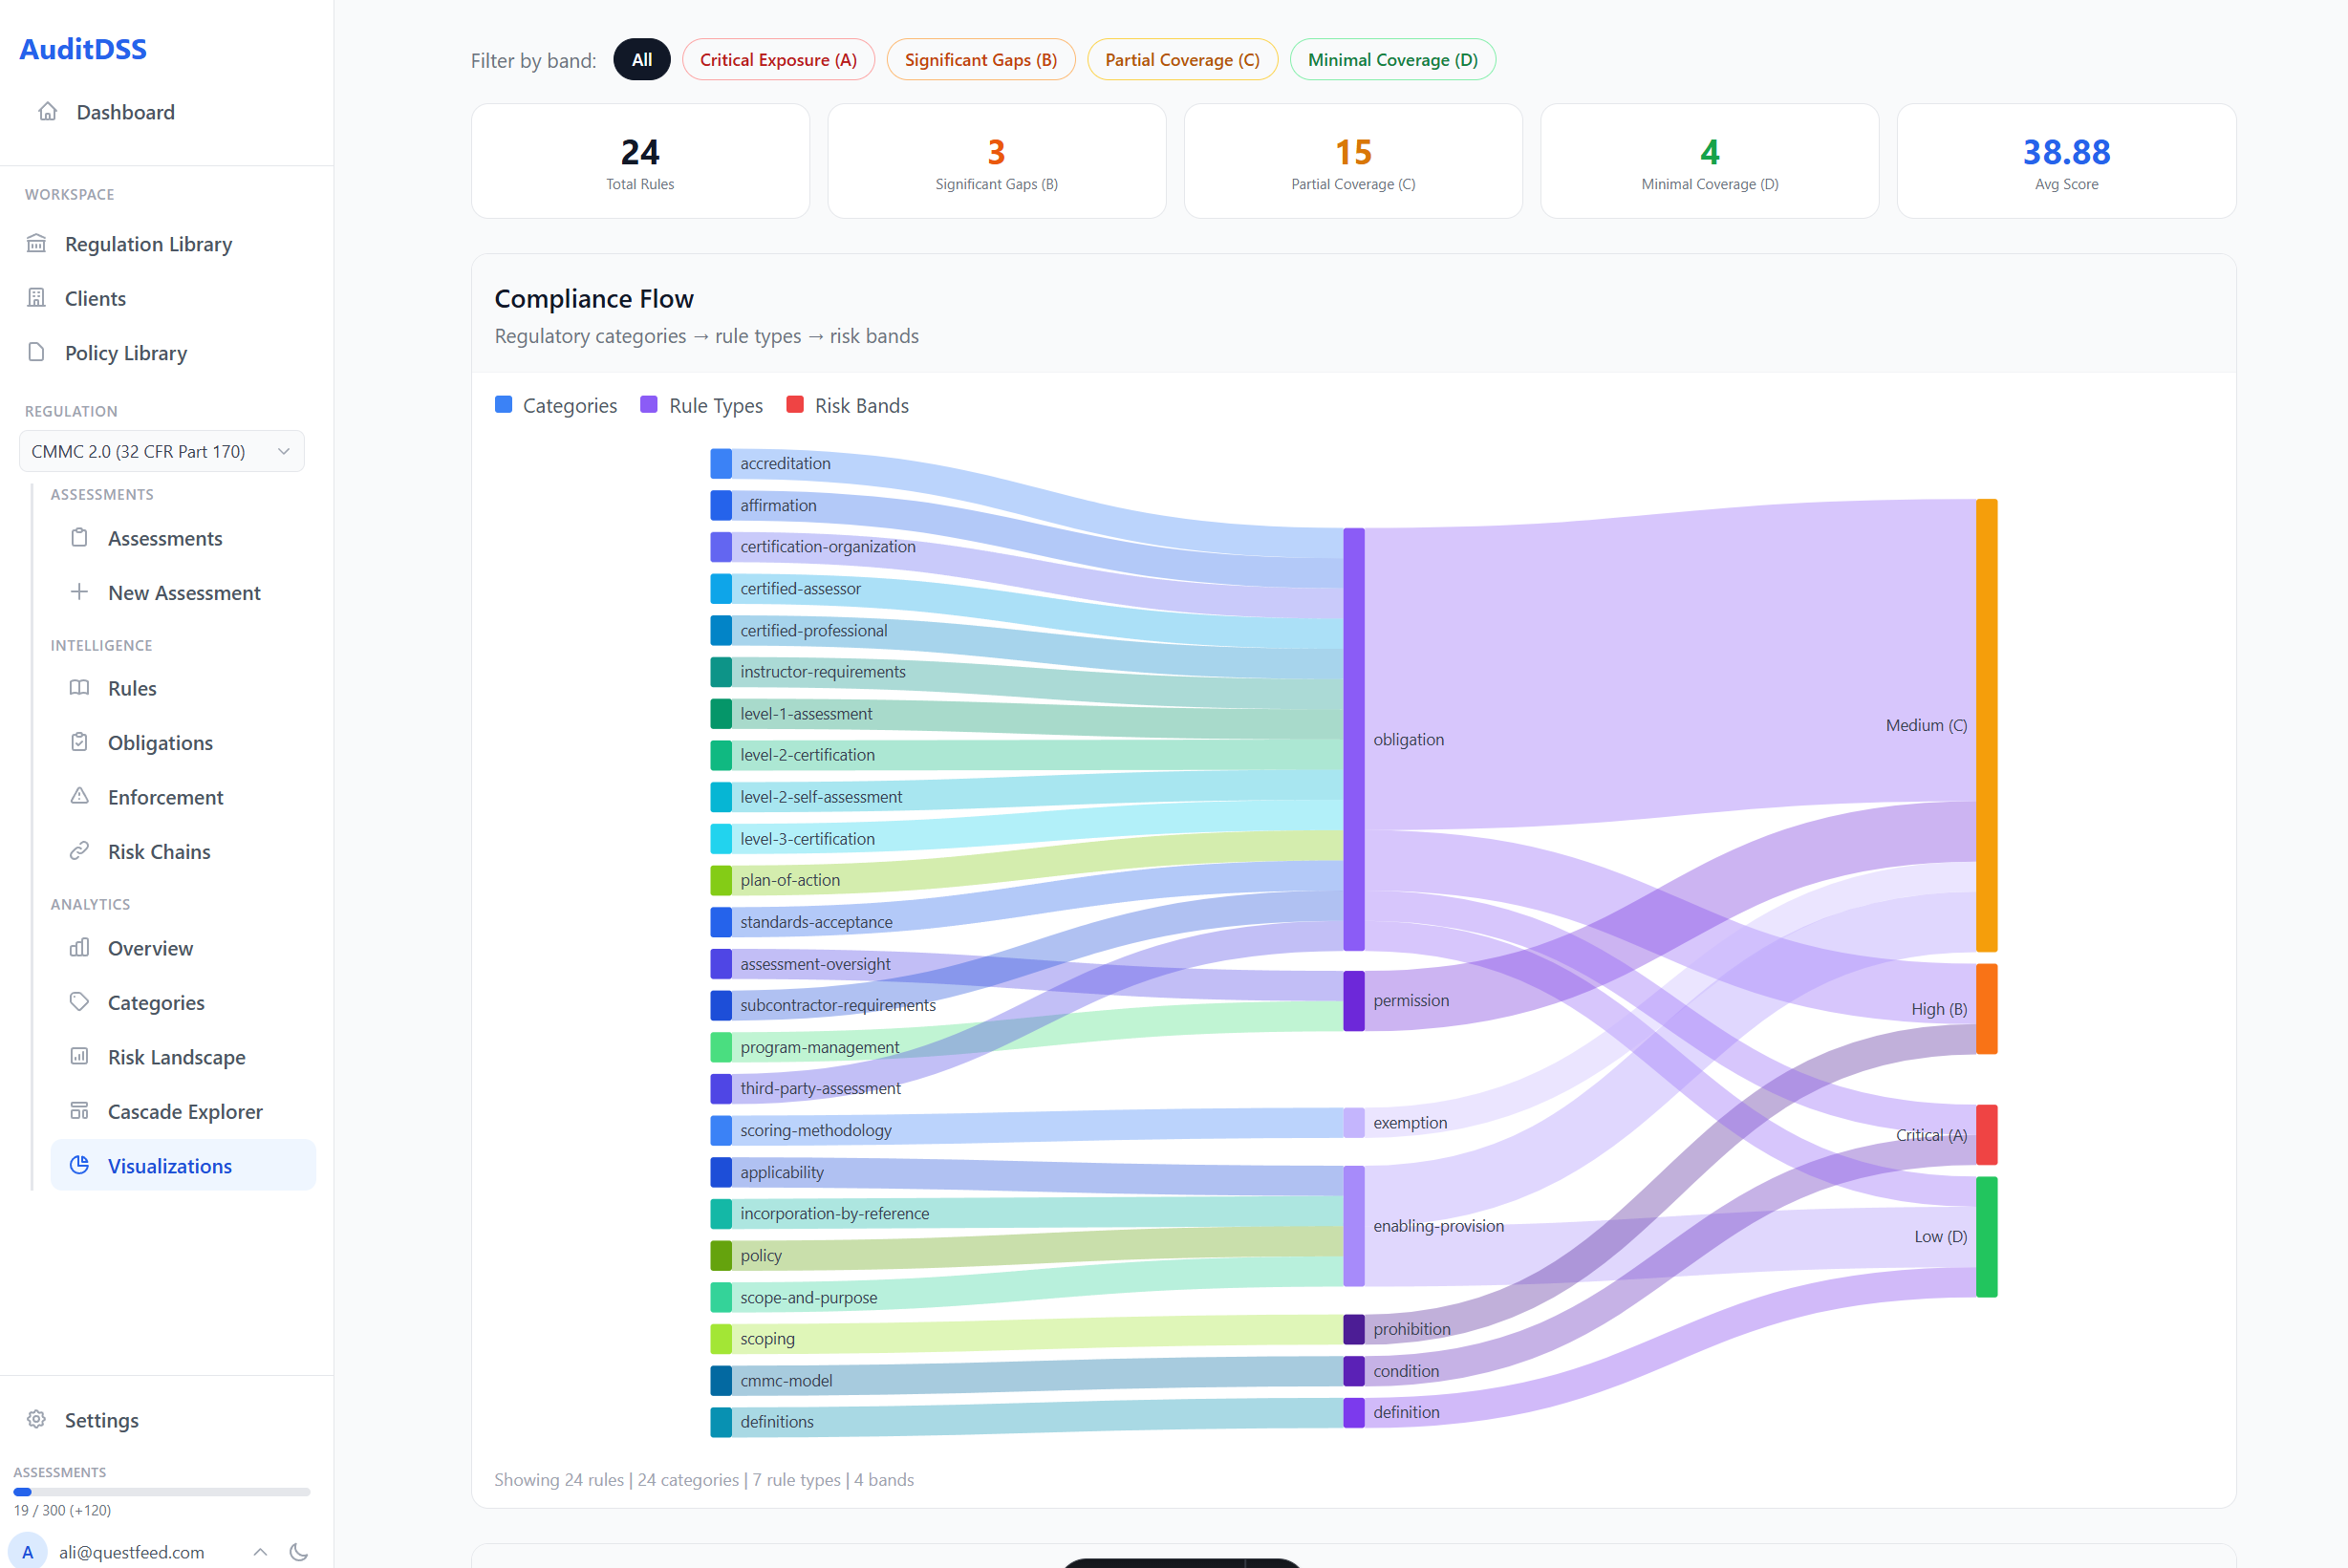
Visual Analysis
Sankey gap flow from categories to coverage status to risk bands, with category-by-coverage heatmap.
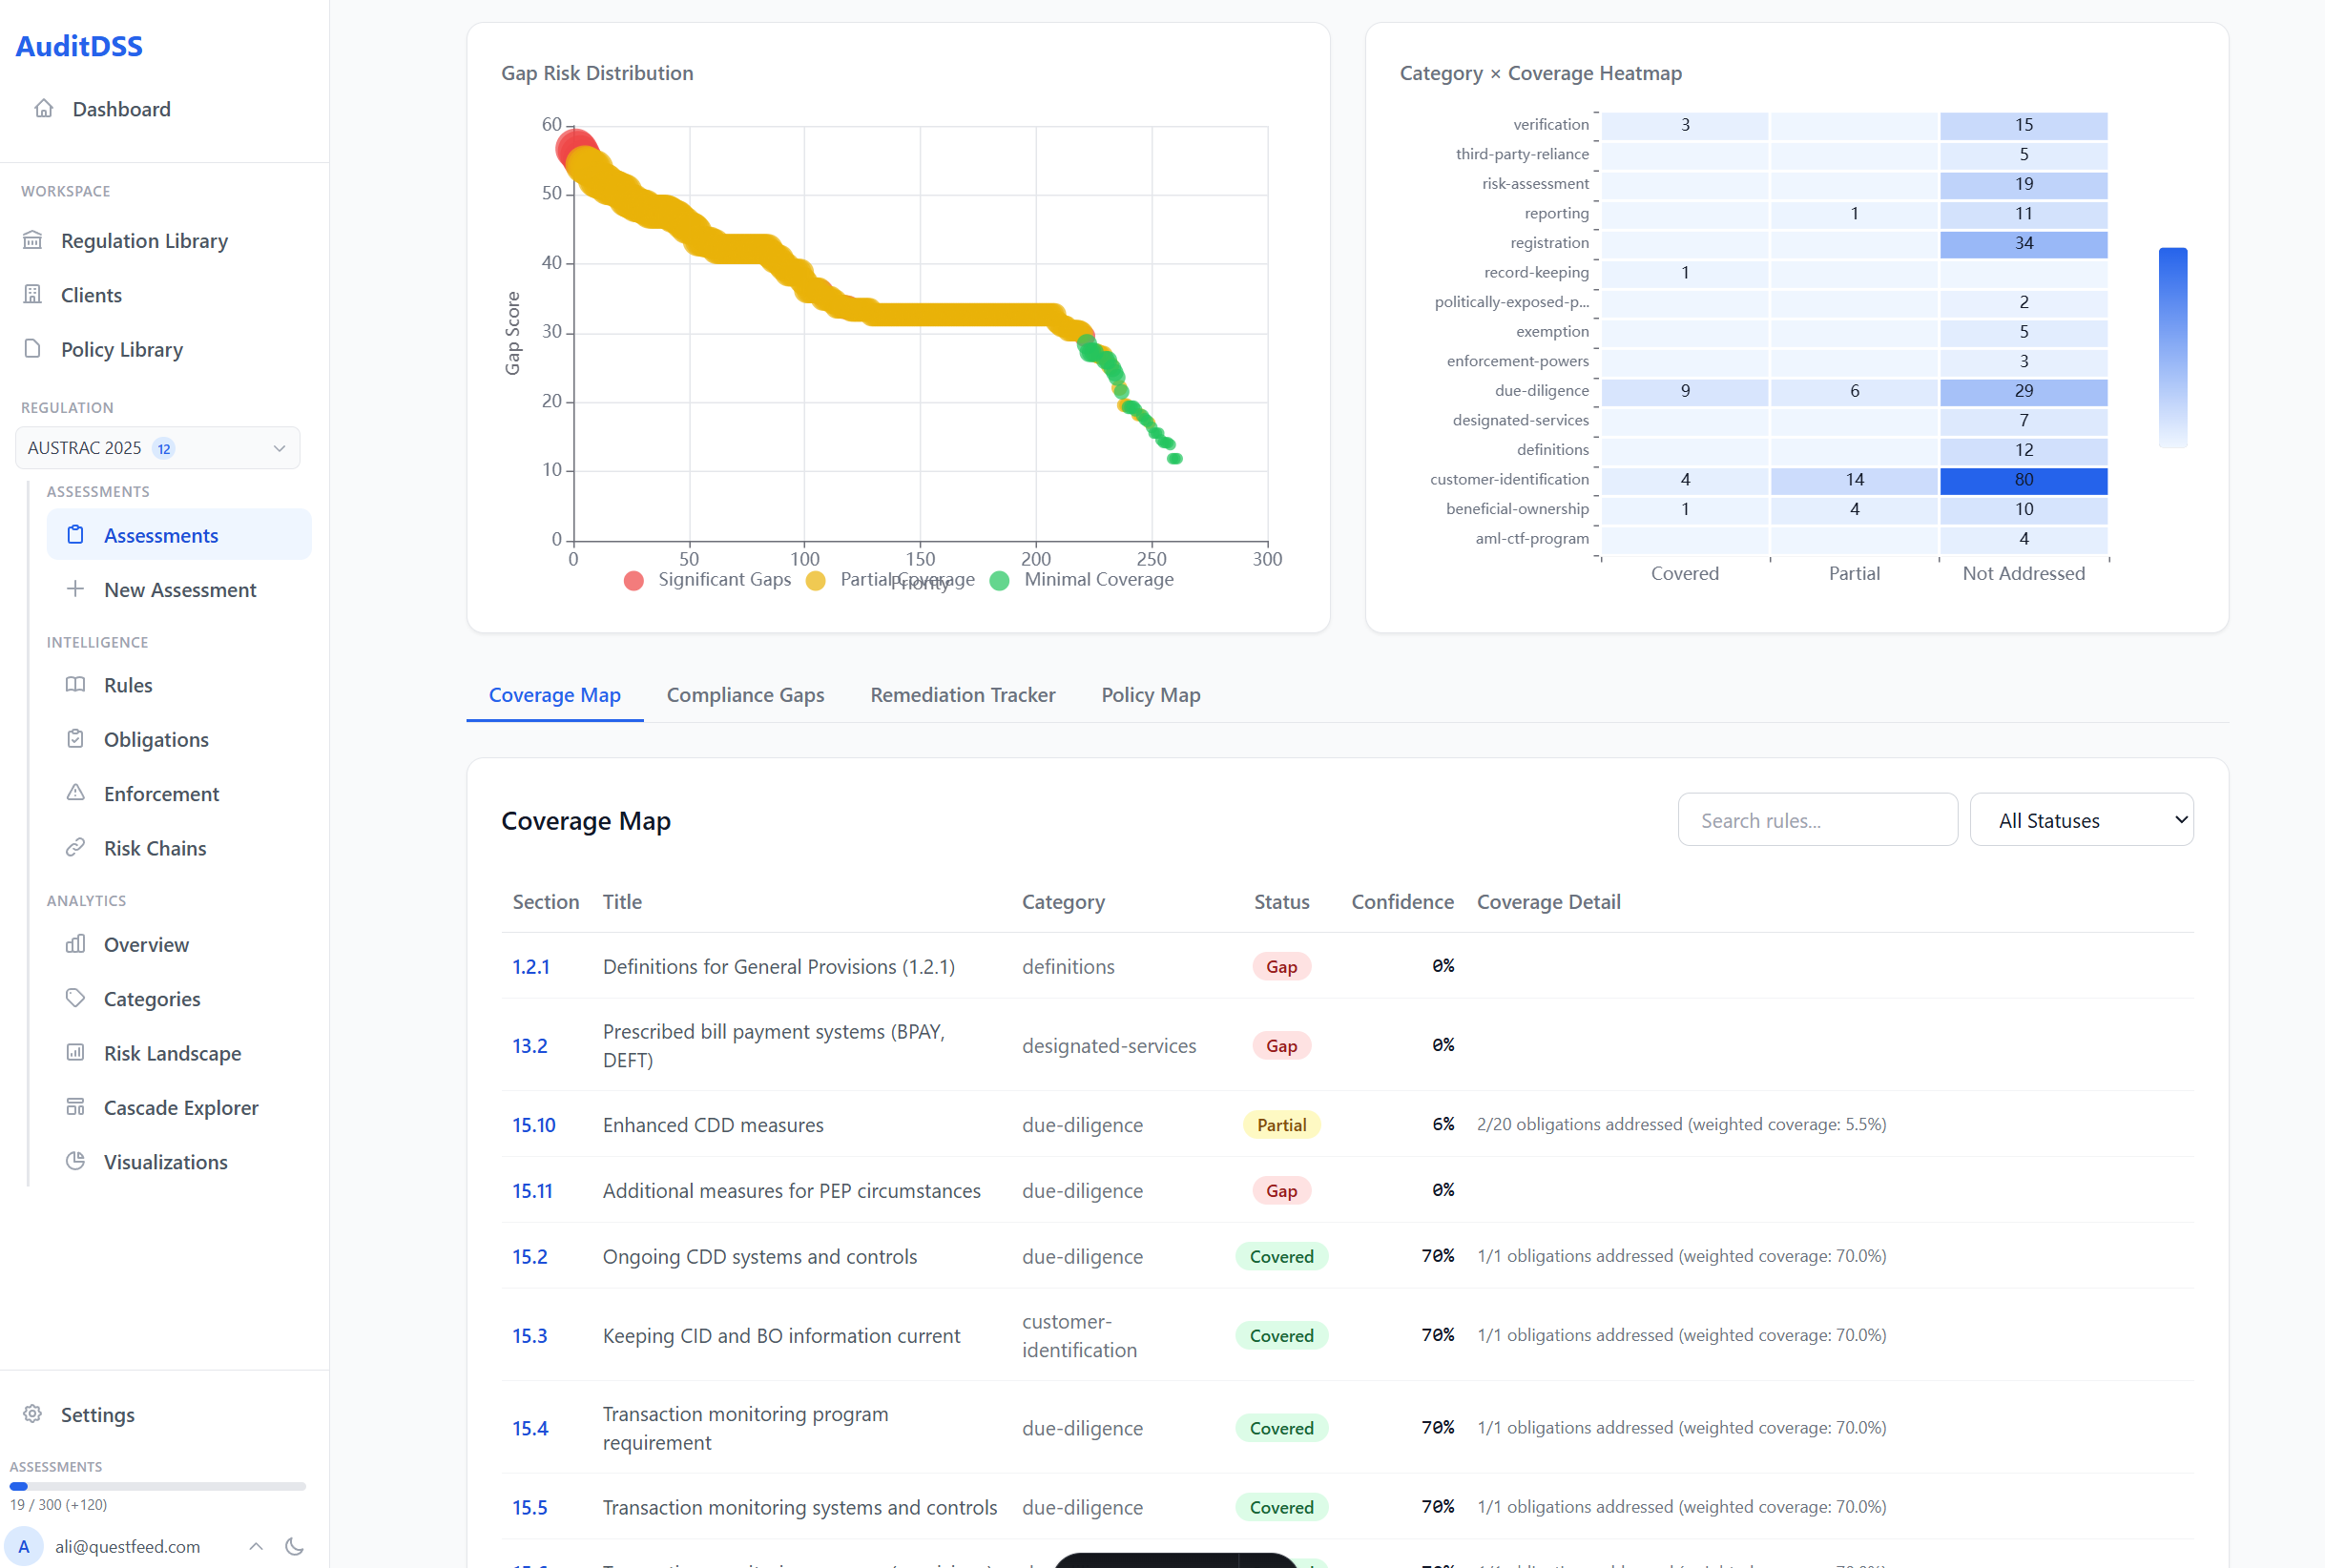
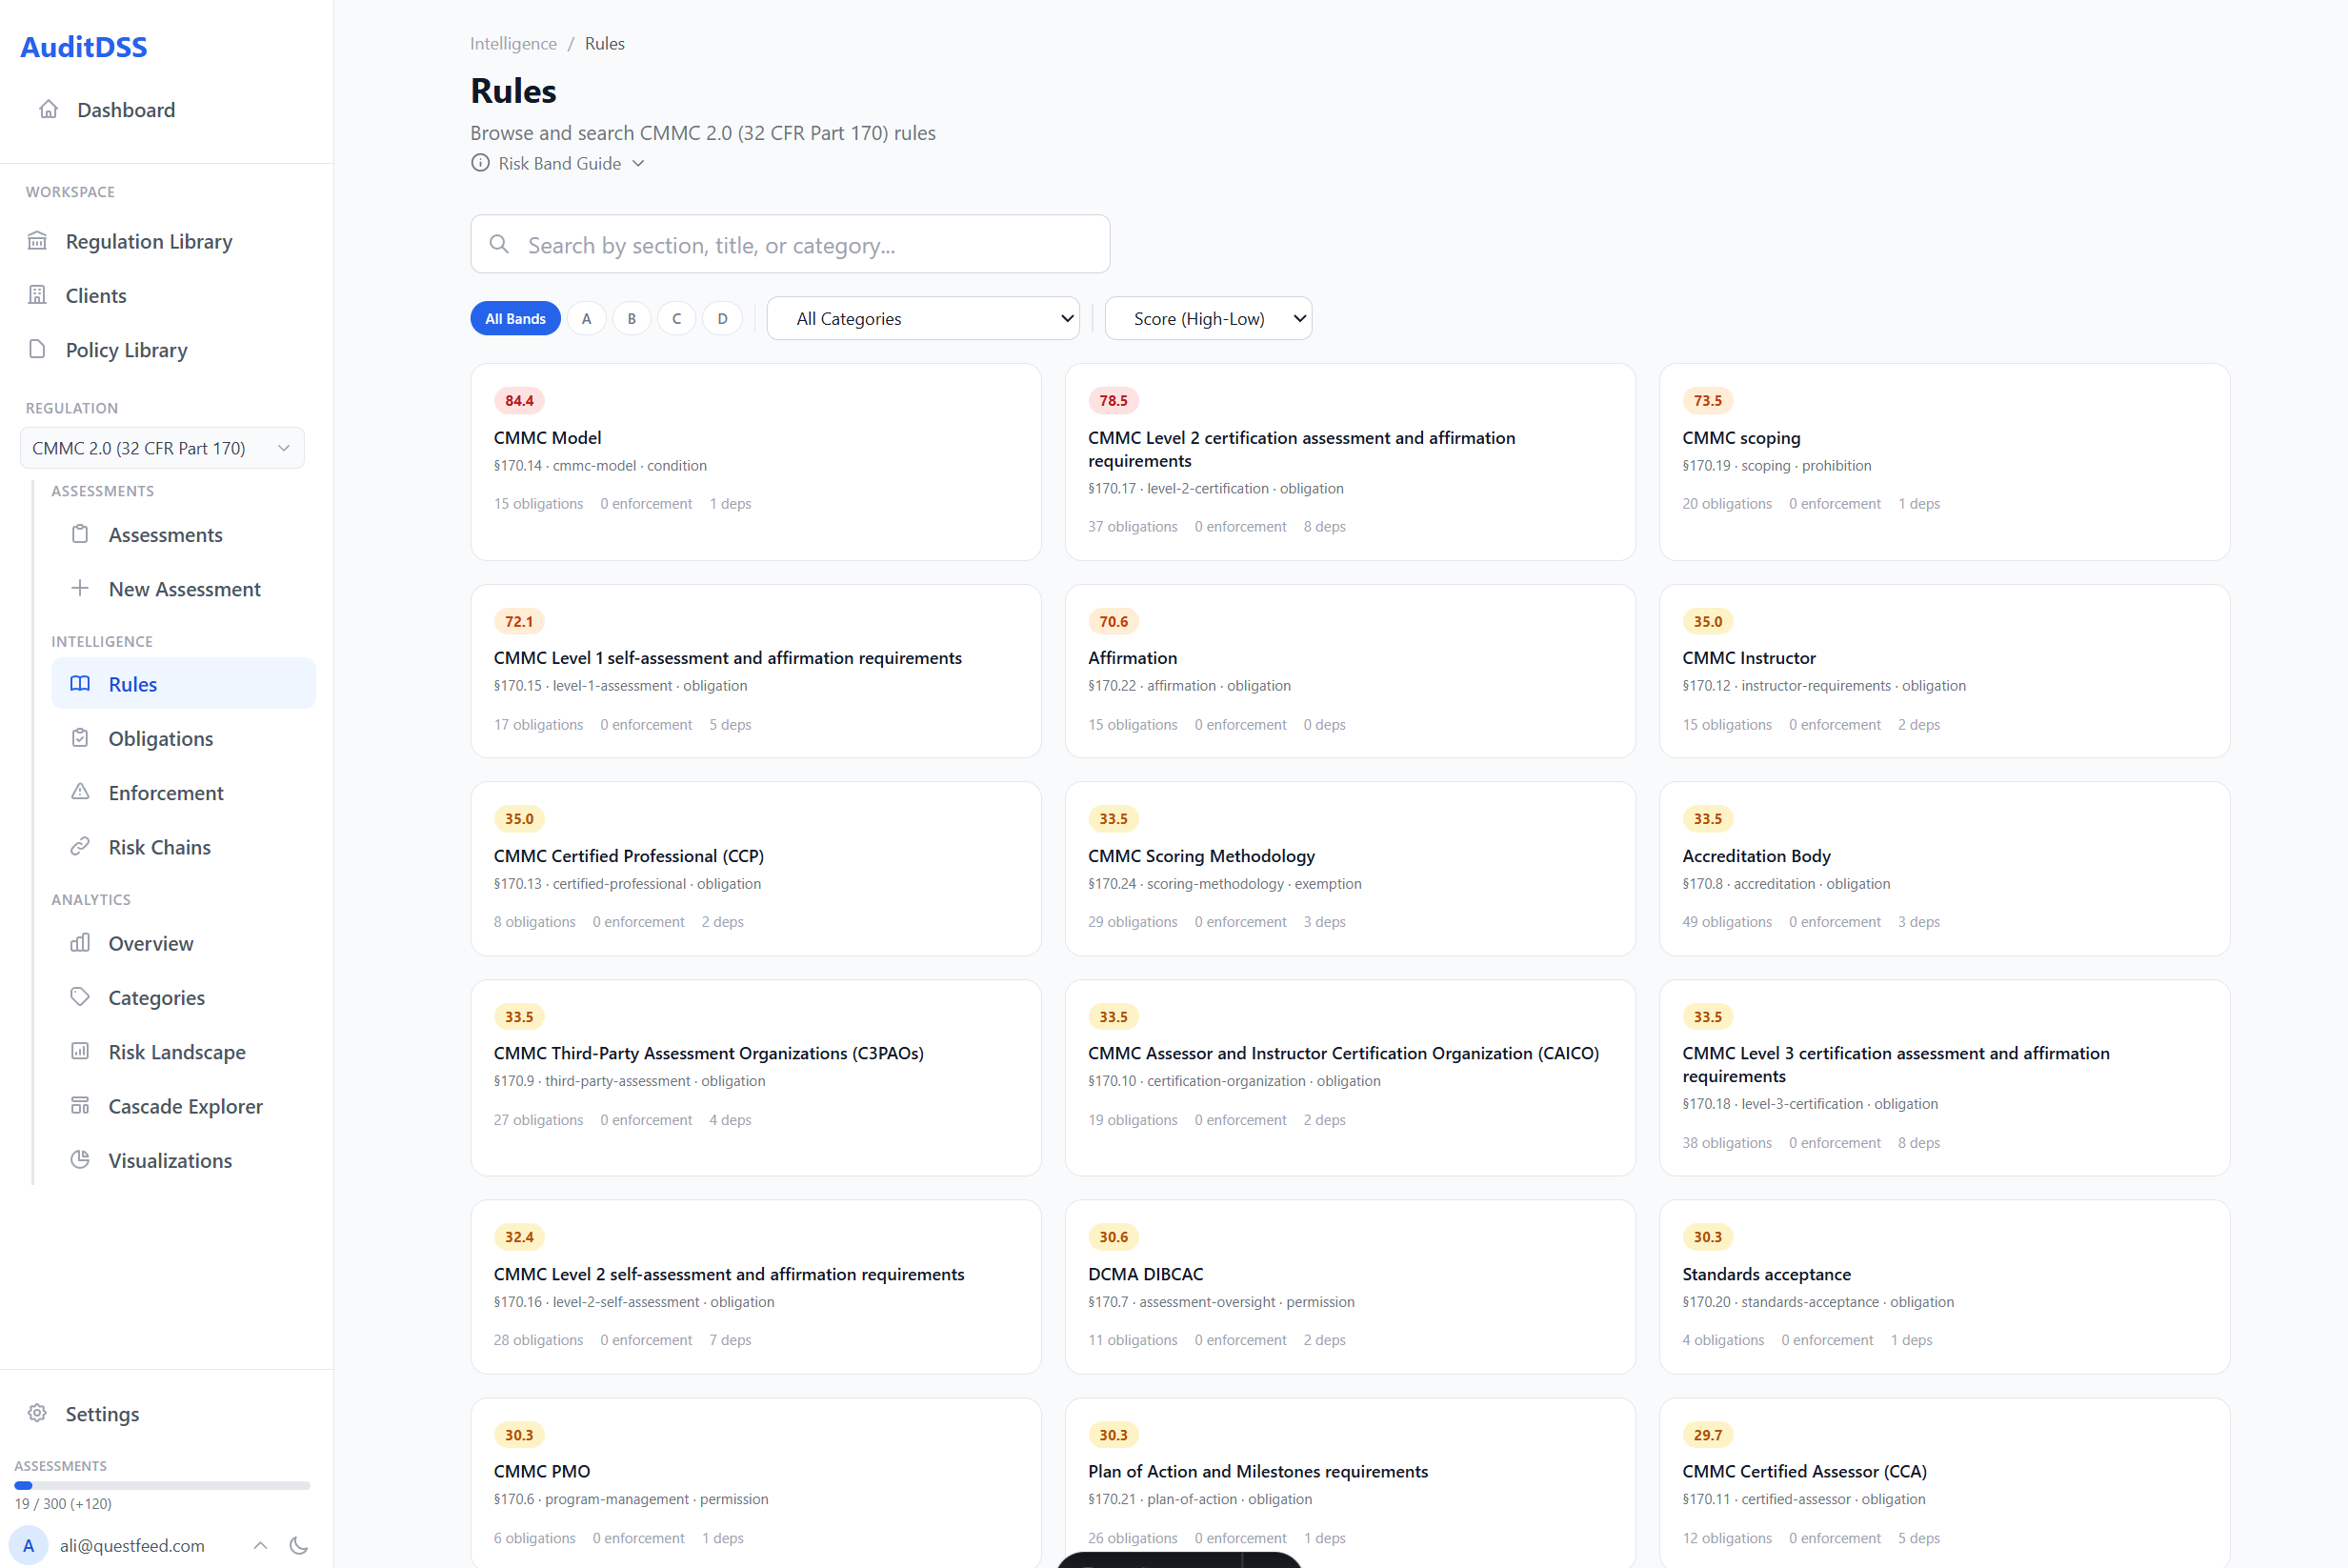
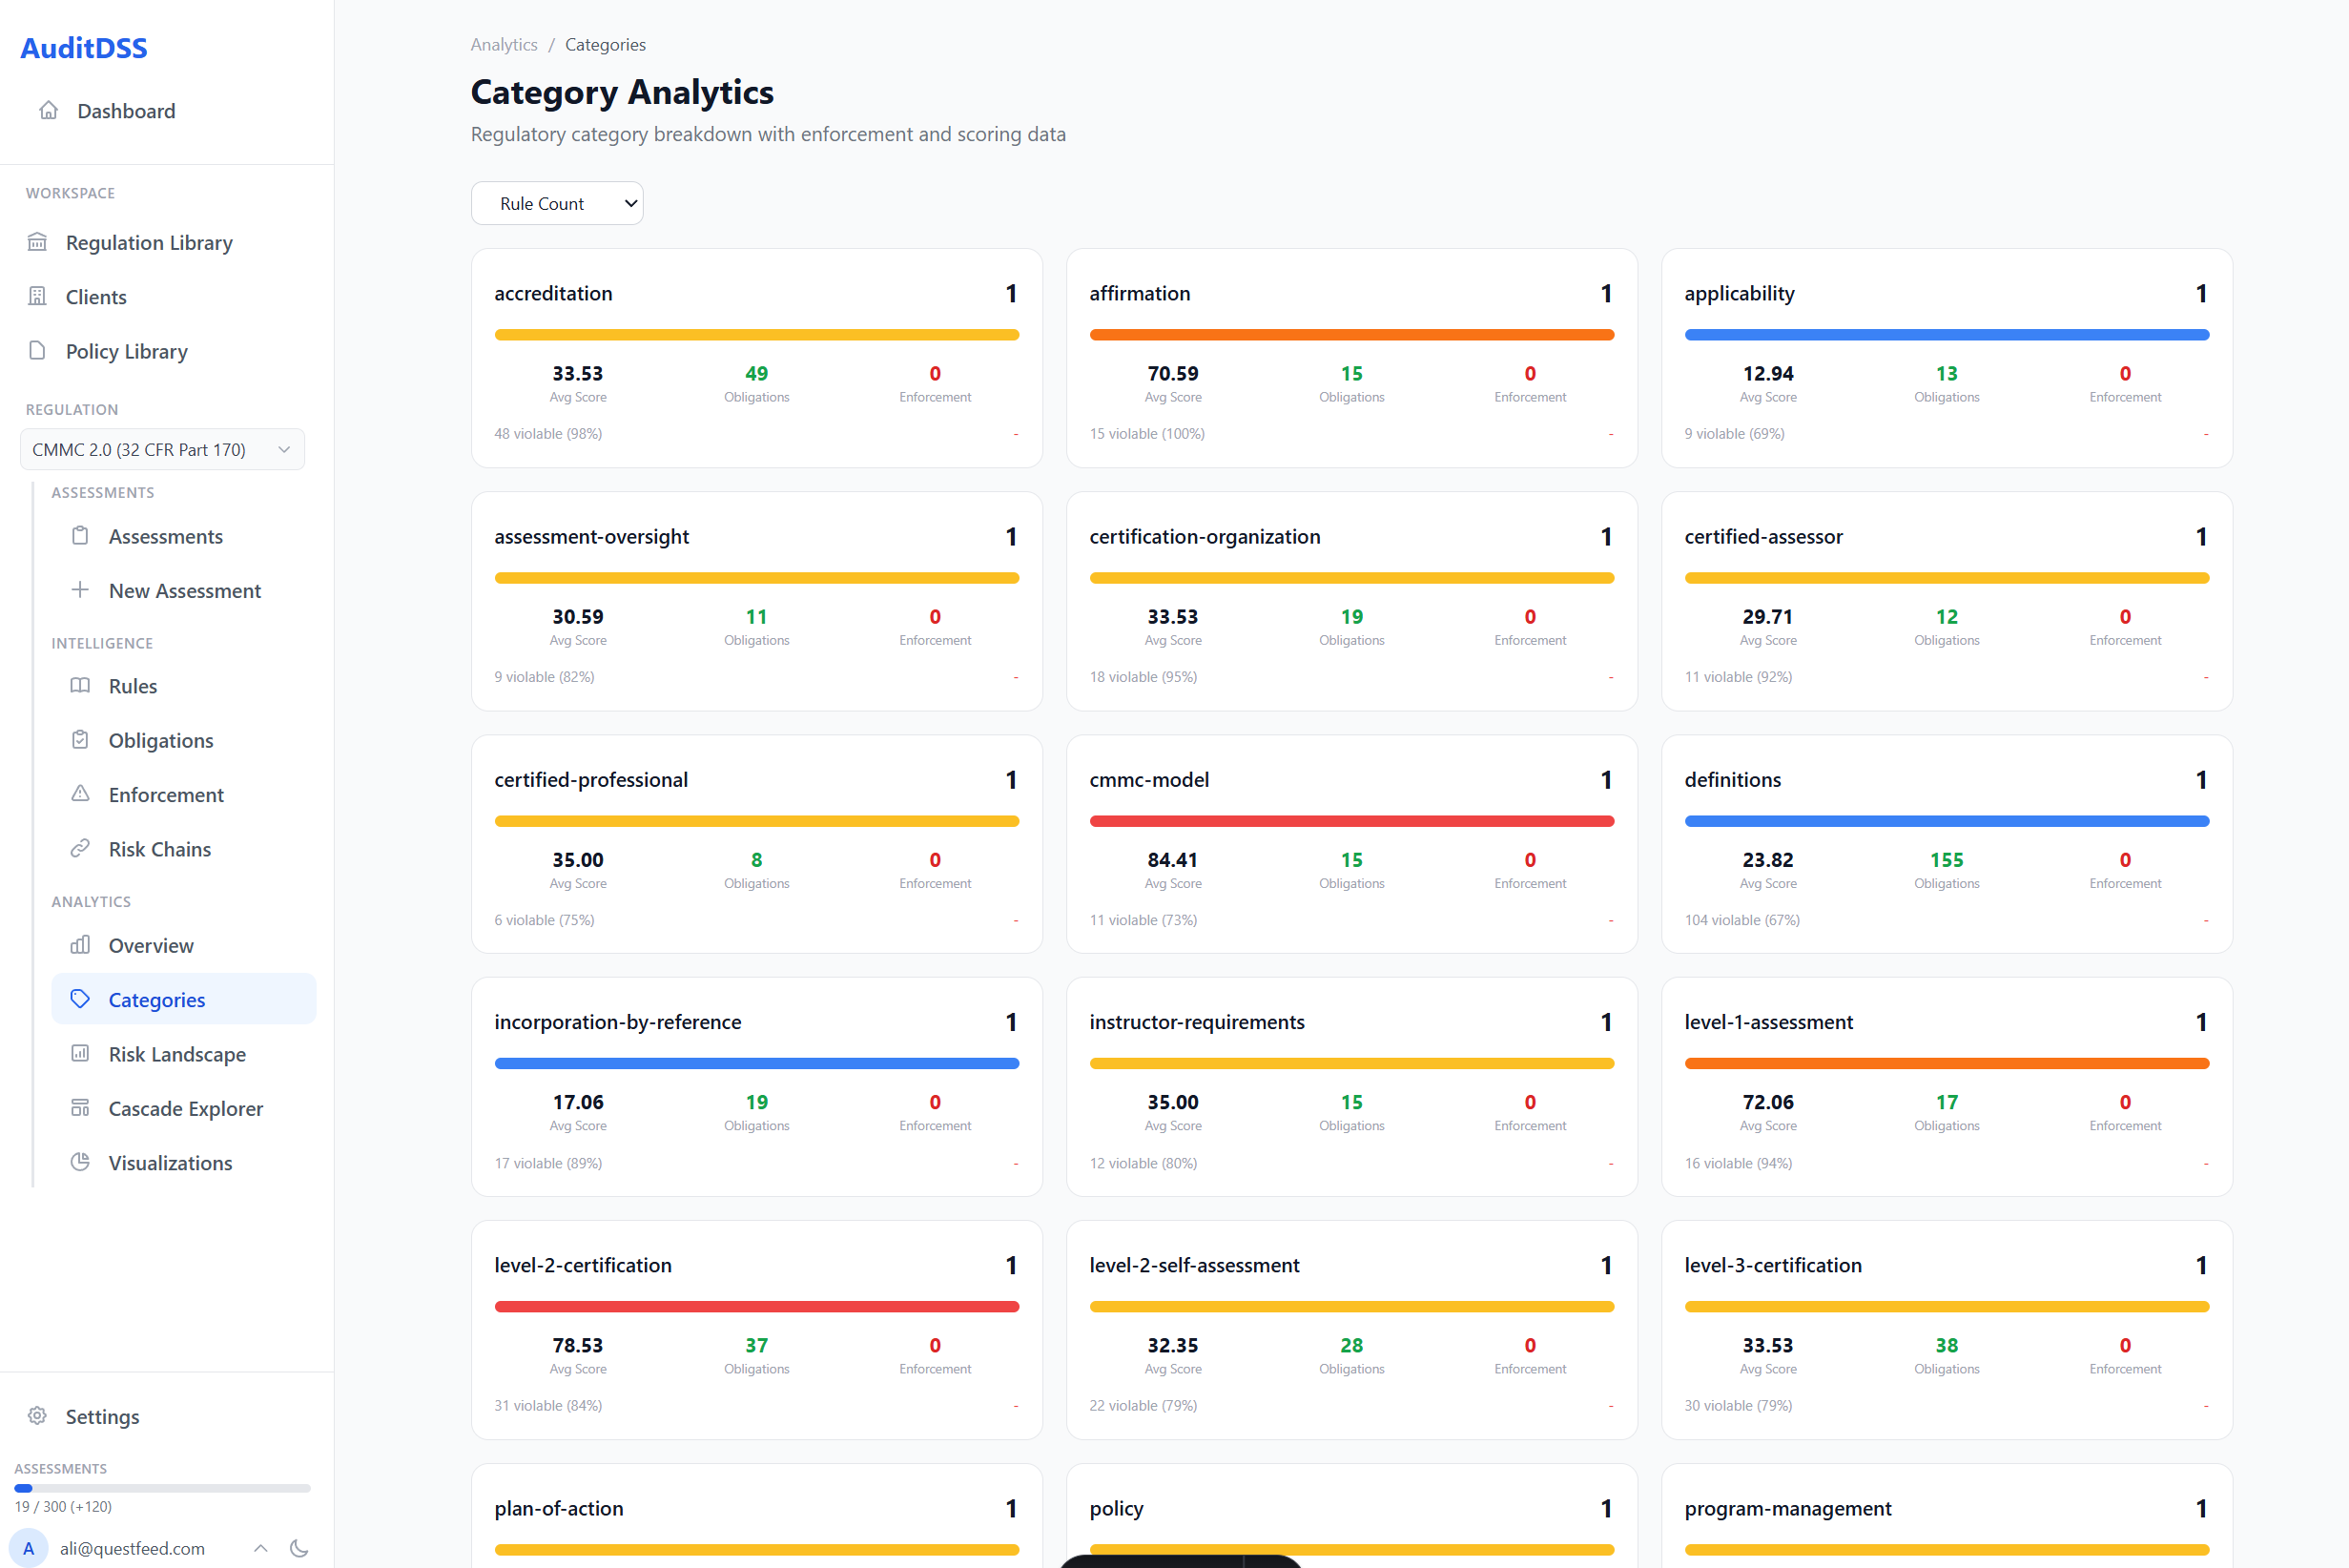
Coverage Map
Rule-by-rule coverage status with confidence scores and detailed obligation-level analysis.
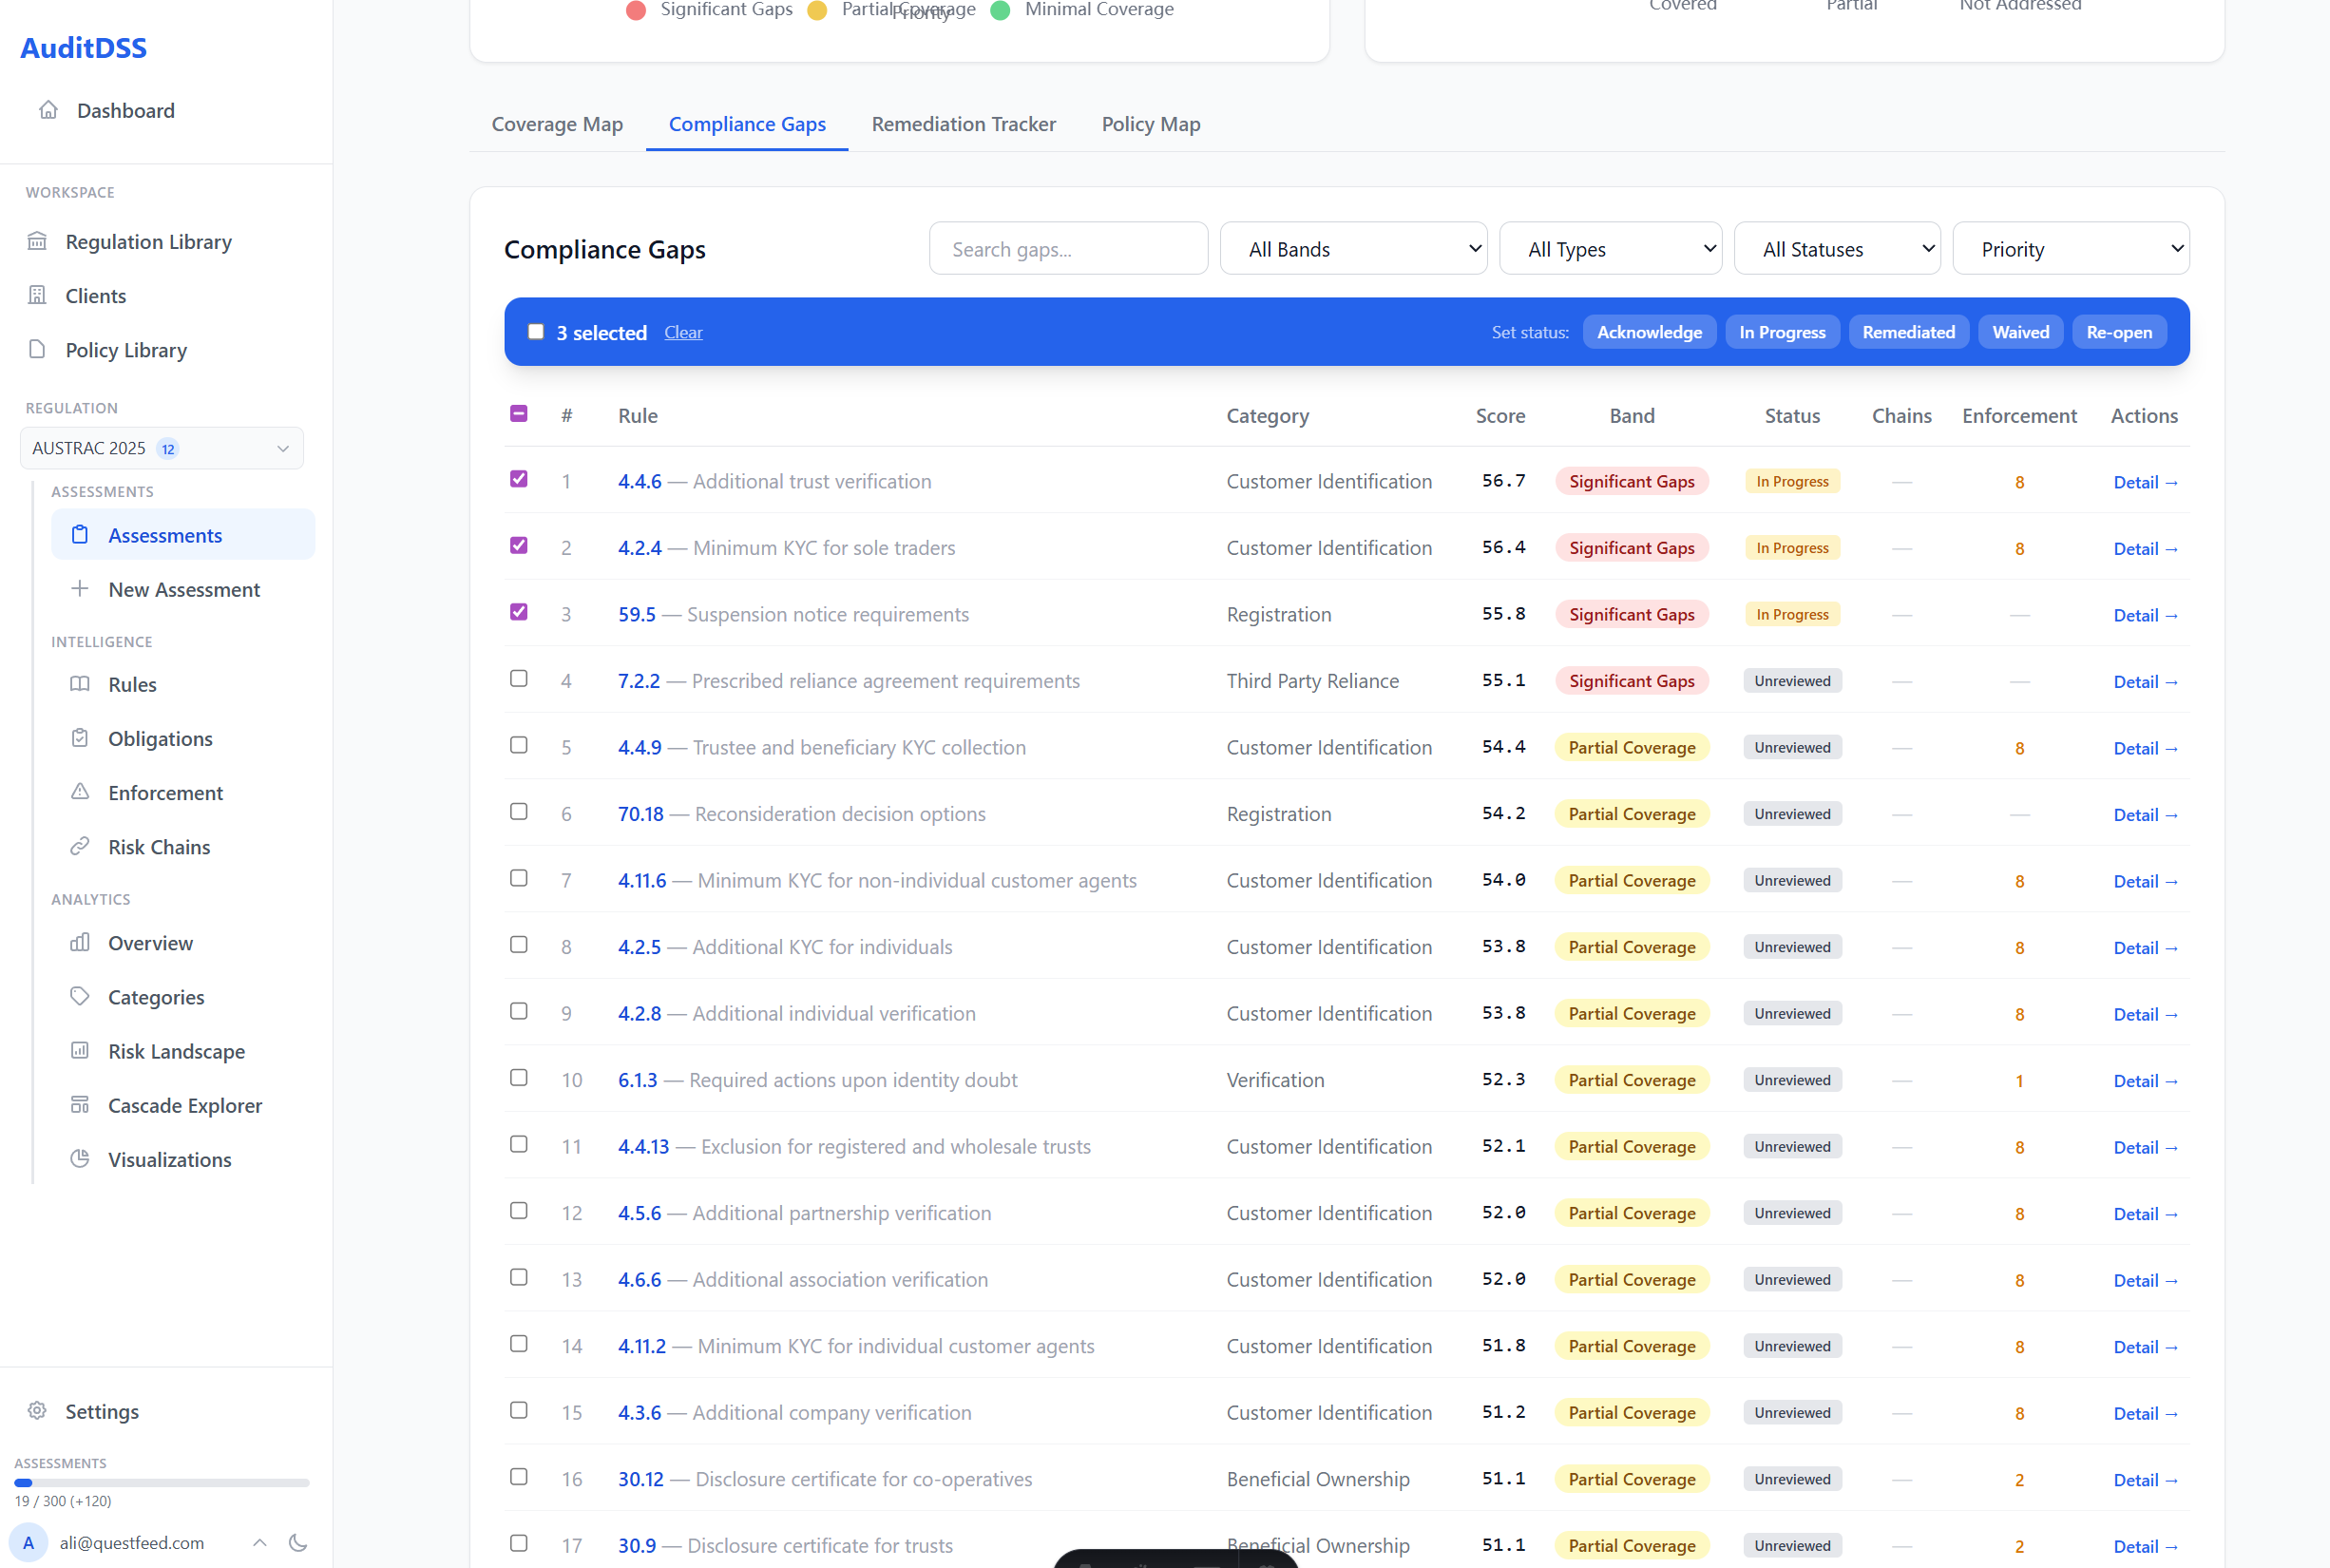
Compliance Gaps
Every gap identified with risk band, composite score, category, and status tracking.
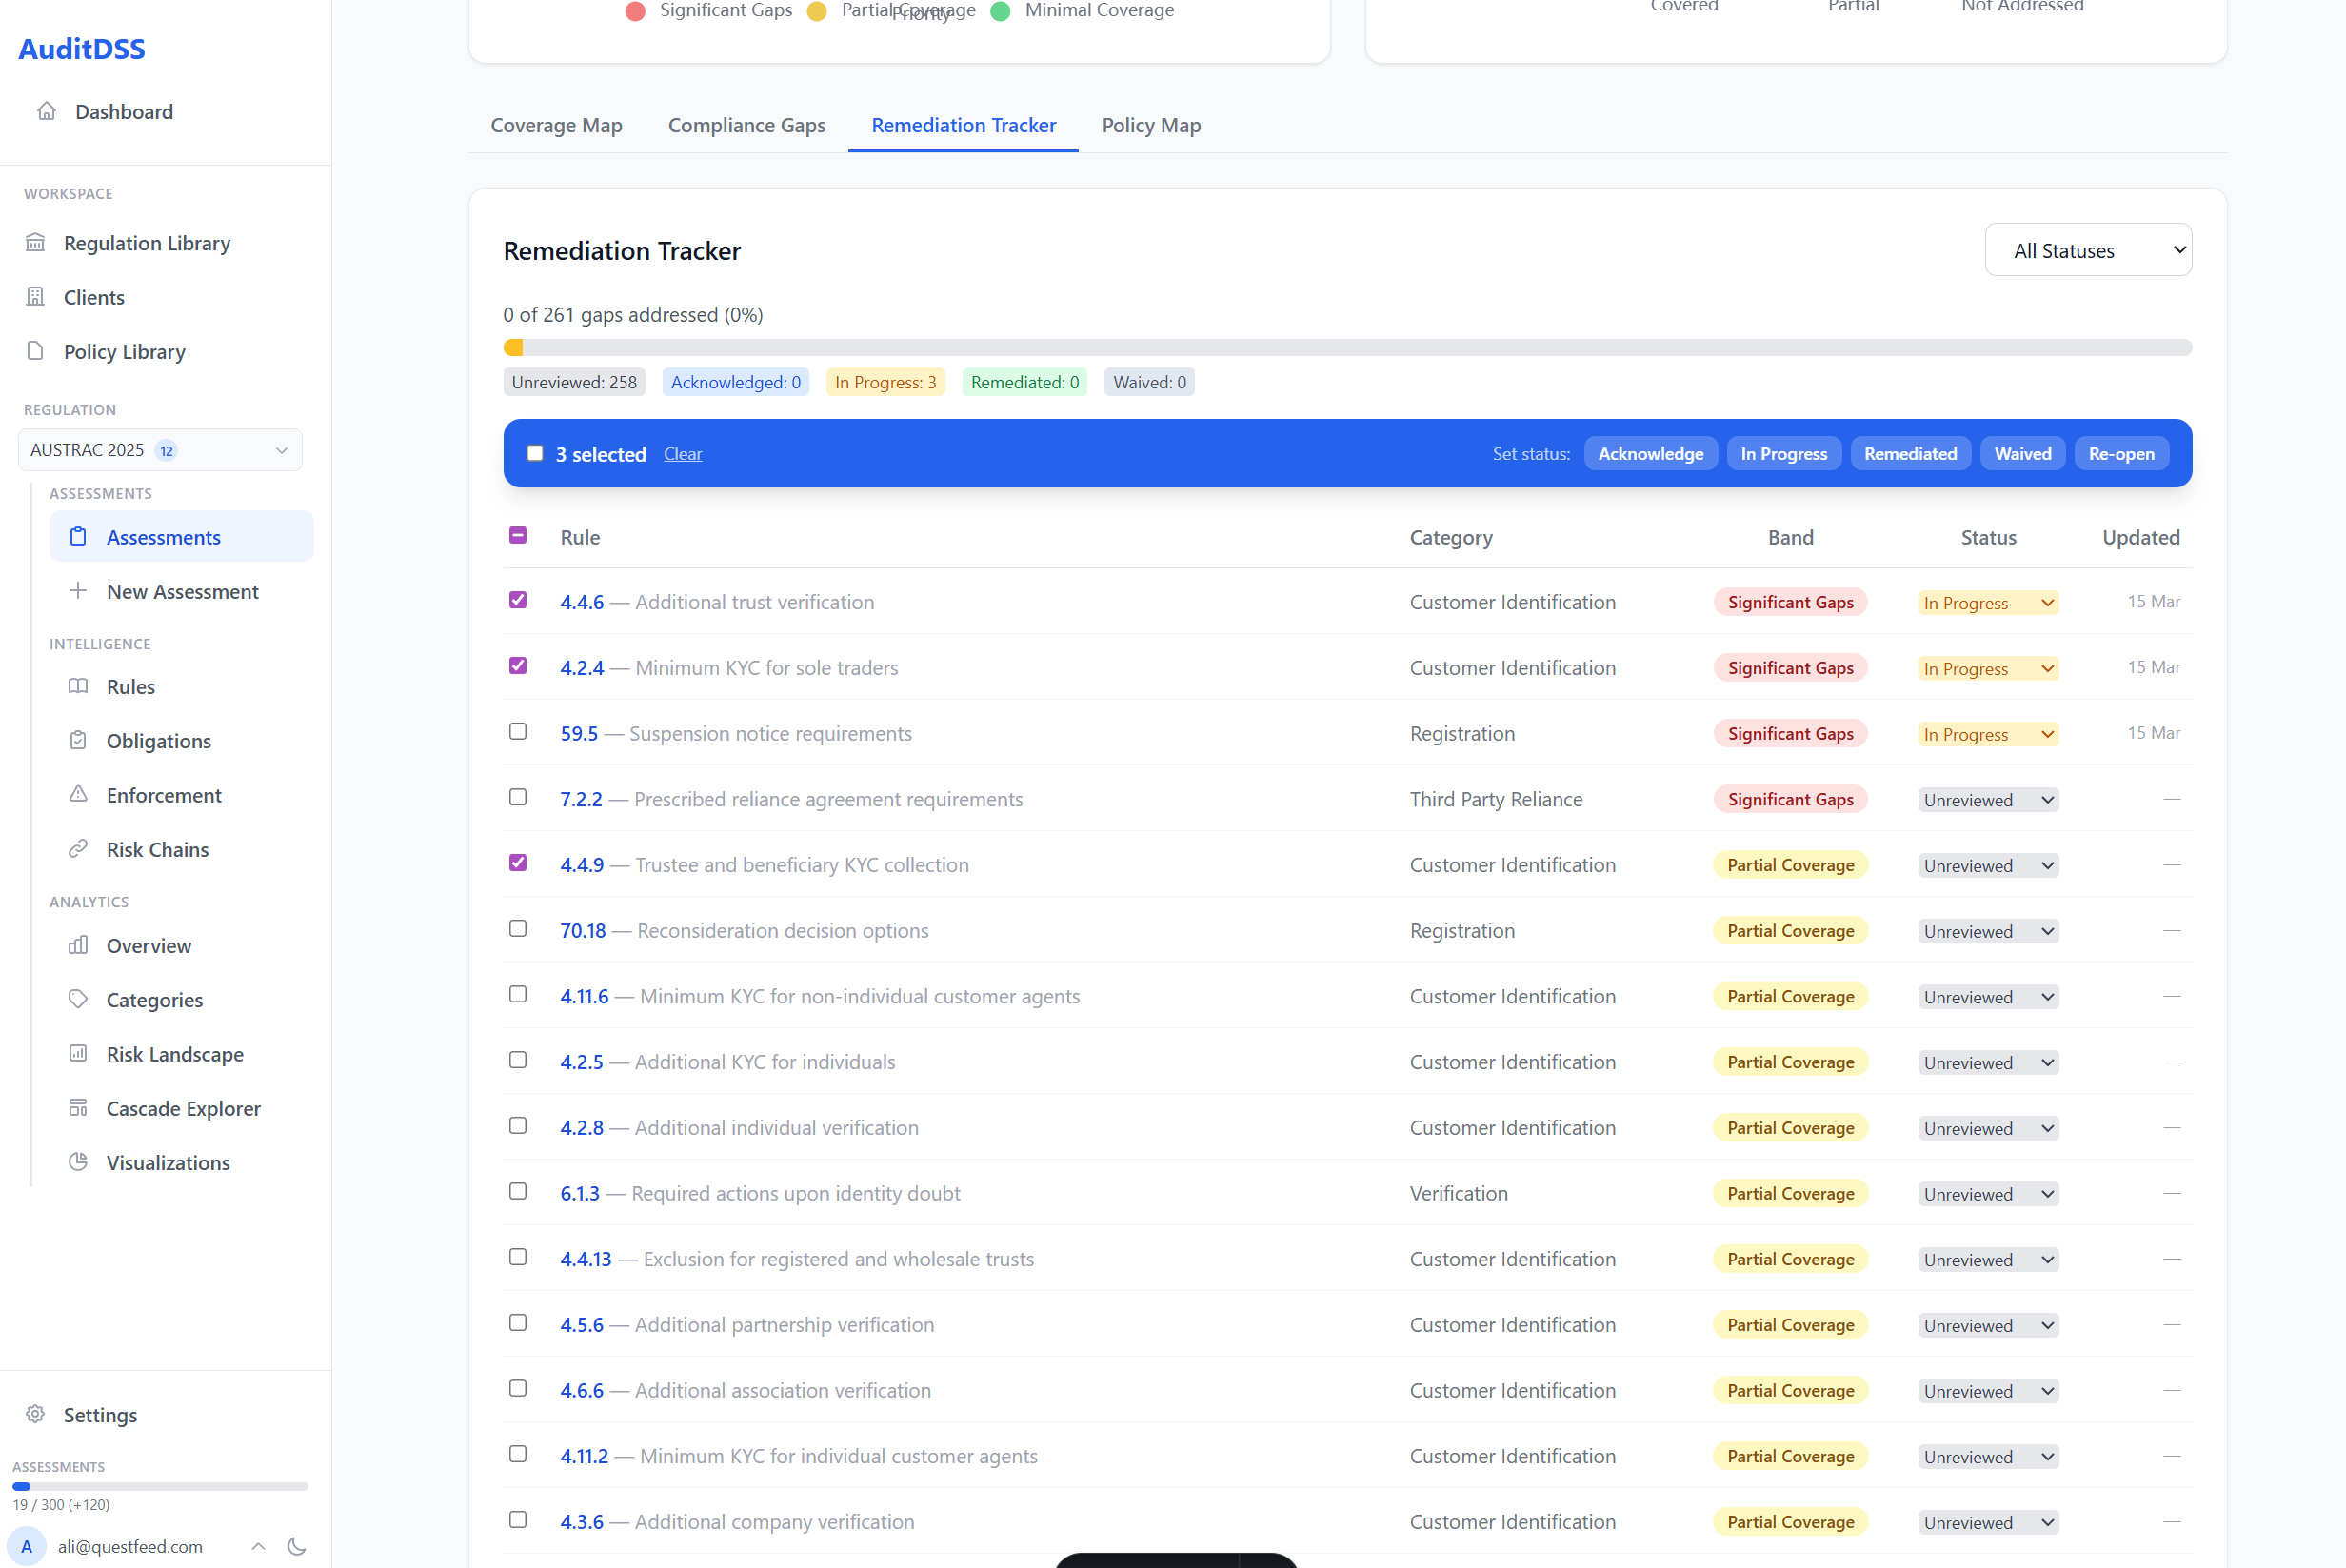
Remediation Tracker
Track gap closure with status workflows: Unreviewed, Acknowledged, In Progress, Remediated, Waived, Re-open.
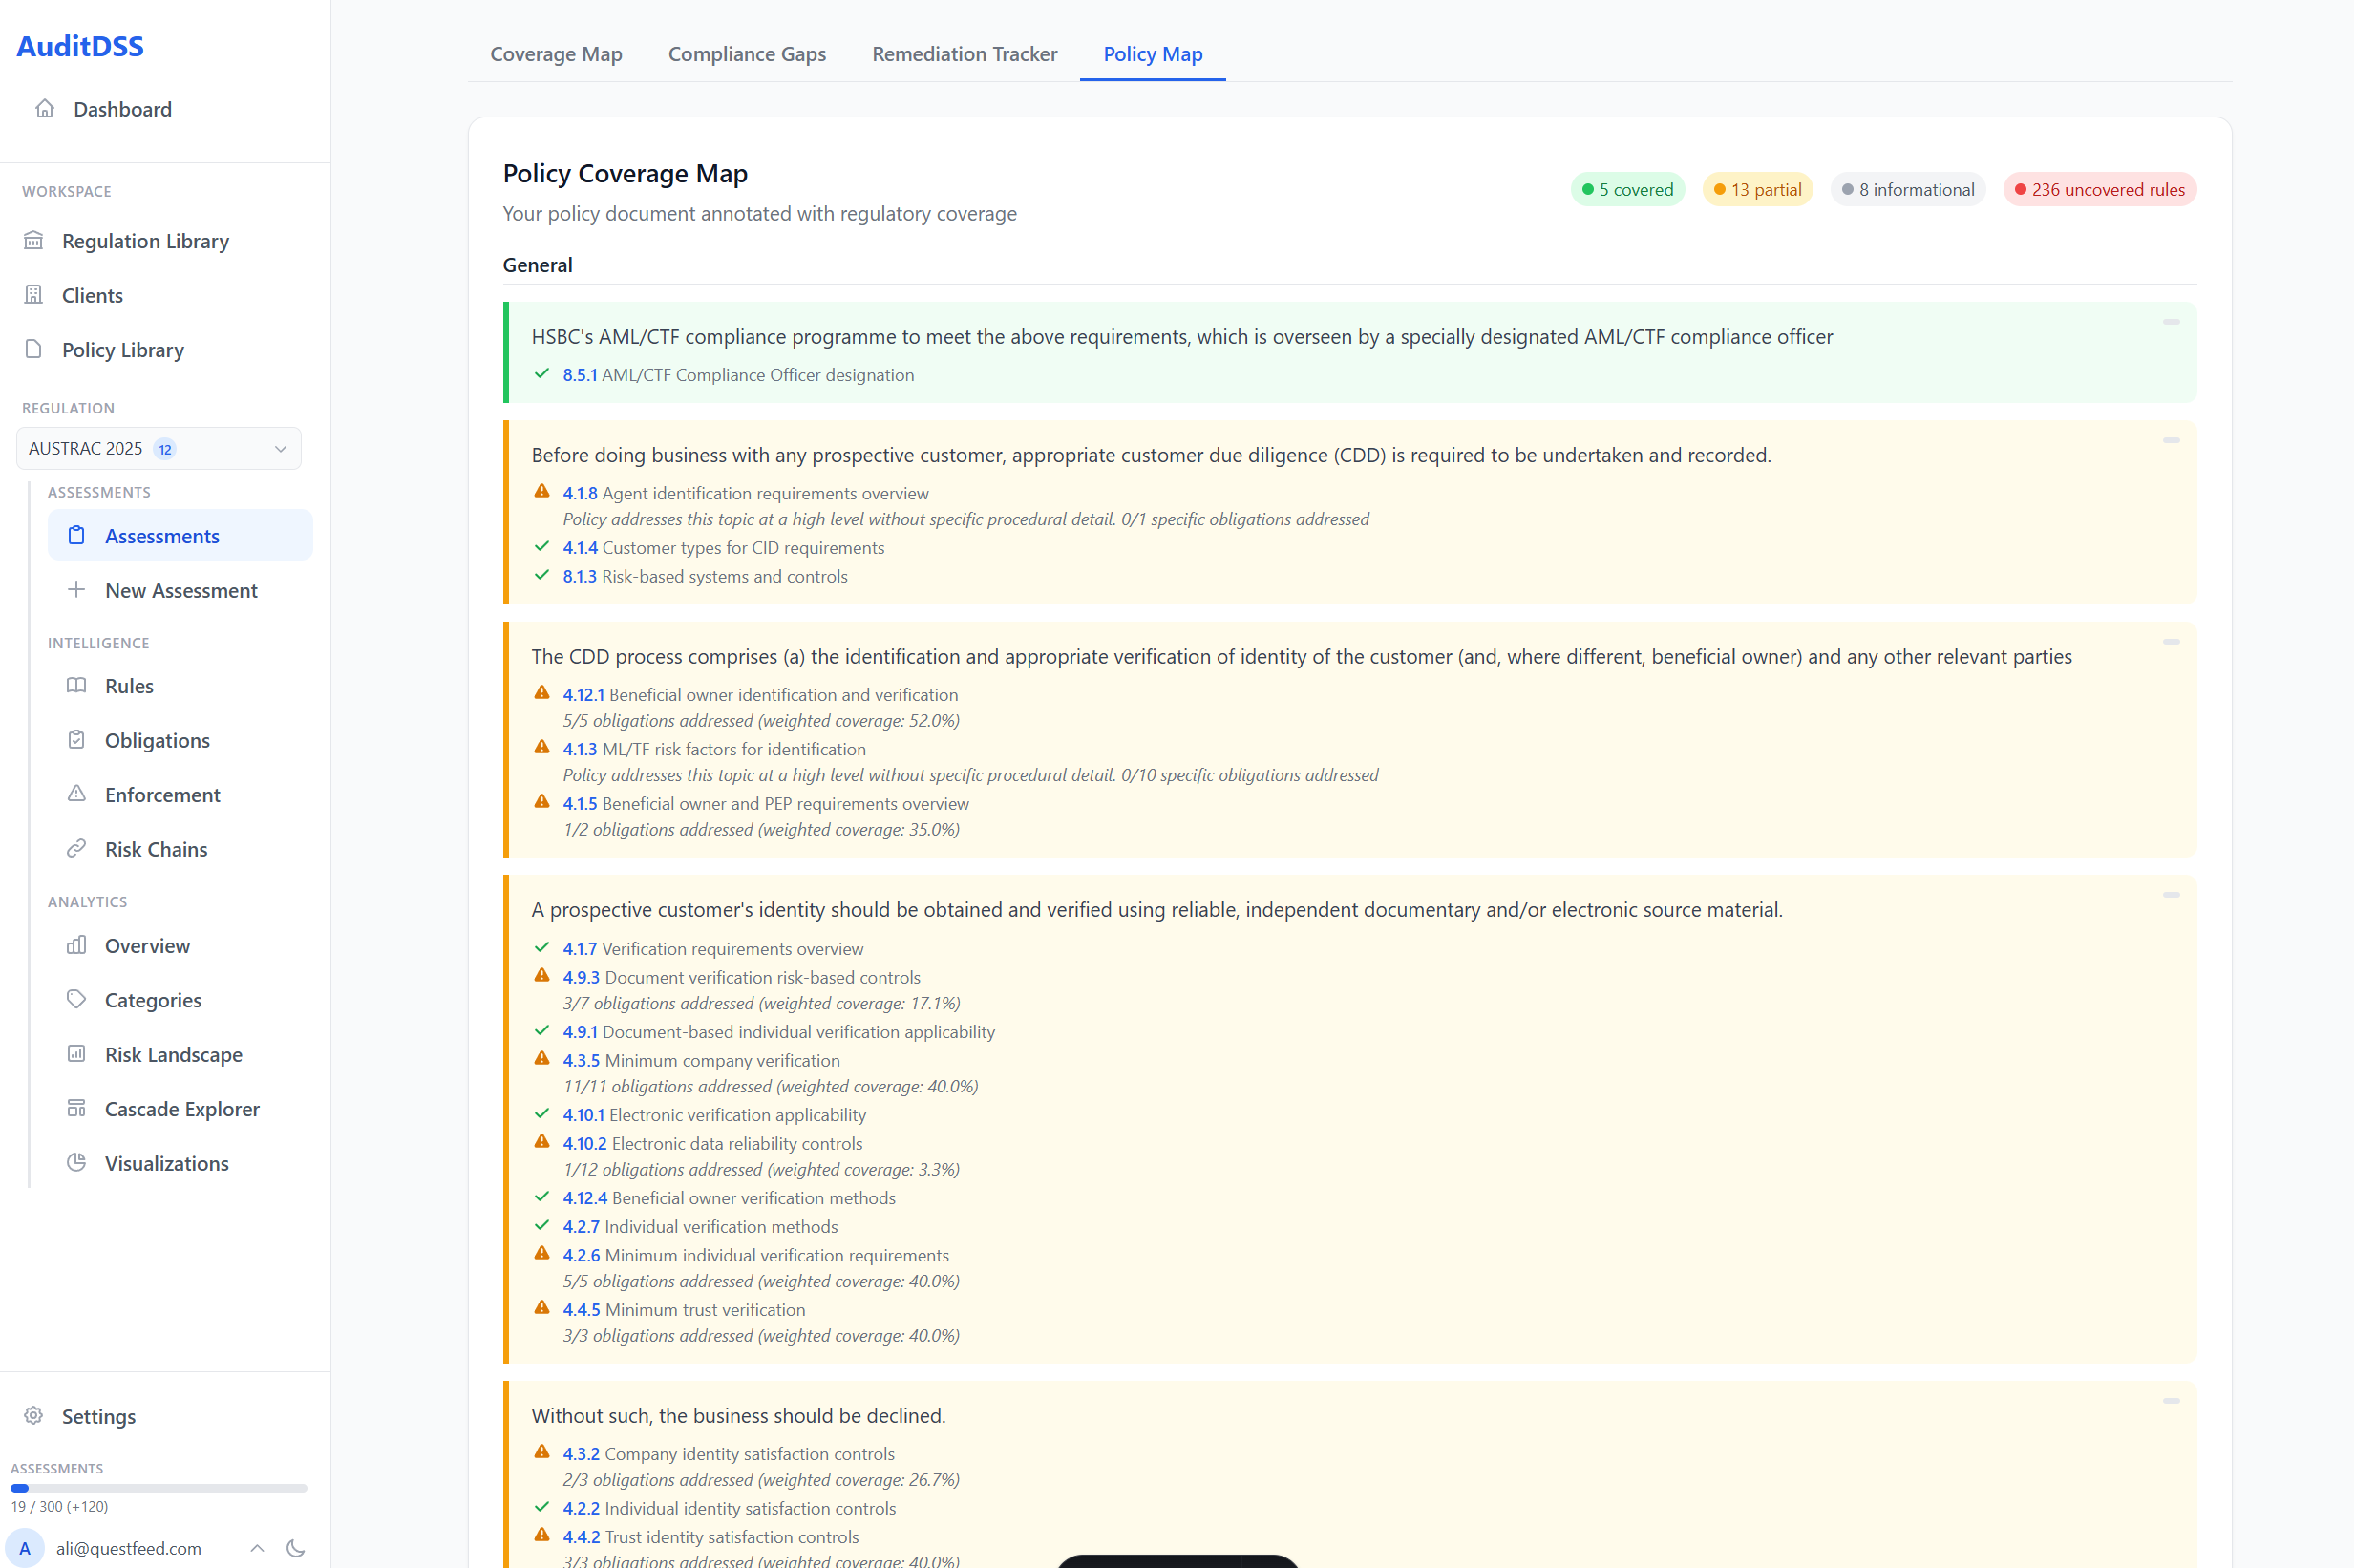
Policy Coverage Map
Your document annotated with regulatory coverage — see exactly which policy statements map to which obligations.
Regulatory Intelligence
Browse the full regulatory knowledge graph. Every regulation is decomposed into rules and obligations, linked to enforcement actions, and scored across 4 risk axes.
Regulation Detail
Full regulation metadata: rules, obligations, 4-axis risk scoring, key requirements, who it applies to, and related regulations.
Rules Browser
Searchable grid of scored rules with risk bands, section references, categories, and obligation counts.
Obligations Browser
Browse atomic regulatory propositions — the smallest units that can be independently violated and enforced.
Enforcement Actions
Historical enforcement data linked to specific rules — see which obligations regulators actually enforce and the penalties imposed.
Risk Chains
Trace how one compliance gap cascades through dependent obligations — see the true blast radius of each failure.
Analytics & Visualization
Aggregate statistics, risk distributions, category breakdowns, and compliance flow visualizations — all calibrated on real enforcement data.
Analytics Overview
Aggregate statistics: total rules, obligations, enforcement actions, risk band distribution, and top regulatory categories.
Category Analytics
Each regulatory category broken down by risk bands, rule counts, enforcement actions, and total penalties.
Risk Landscape
4-axis scoring distributions: Obligation Weight, Violation Likelihood, Enforcement Evidence, and Cascade Depth.
Compliance Flow
Interactive Sankey diagram mapping regulatory categories to rule types to risk bands — see where risk concentrates.
Upload your compliance document and get obligation-level gap analysis with risk-scored findings in under 5 minutes.